Developers like when everything is under control. Being developers we certainly know that. In everyday work we use various debuggers, profilers, testing utilities and multilevel logging system to avoid any hint of uncontrolled behavior in our product. So if your developing application depends on remote device it would be desirable to have an access to it or at least control it's state. And sometimes it is not just desirable – this is vital.
Based on our rich experience in developing telematic software we know that developers often face a necessity of remote diagnostics. For that purpose we use different sniffers with packet disassemblers, protocol emulators, encrypting transceivers and tools to look for a needle in huge haystack of binary data.
Some of these tools requires really strong experience in hardware diagnostic. It is rather hard to use and not always helpful. So, implementing our diagnostic tools we assumed an idea of reasonable sufficiency. Let's consider the next scheme, that shows information stream from physical objects you need to control and flespi Gateway through tracking device.
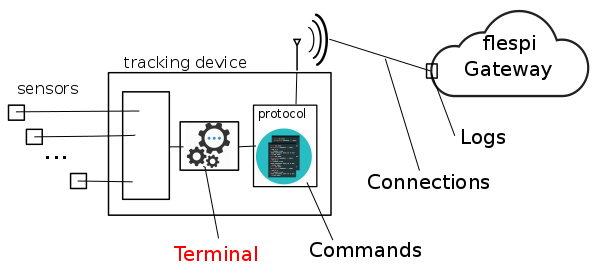
We can see that data from physical objects is processed by tracking device, and sent via connection to flespi Gateway in a format,defined by device protocol. We provide you control of every stage.
Channels logs represent an upper level of diagnostic tools. Every connection/disconnection event leaves log record that can be sorted by time and channel. You can control some device's connection problems by frequent reconnection logs. You can catch your cellular operator disruptions seeing simultaneous disconnection of multiple devices. And so on.
On step below there is a tool to control every TCP connection which allows to get a list of all connected tracking devices at the moment. Moreover, every connection can be forcibly closed. E.g. if you see that connection is active but there is no messages for a long time, you can break the connection which will force the device to reconnect and start to send collected data.
Most protocols support bidirectional communication so it would be foolish not to use it. This option provided by channel commands interface. You can change tracking device's settings, force it to reboot, or request for diagnostic data – features set is only limited by protocols specifications. If device is disconnected at the moment the command will be stored in a waiting list an will be sent as soon as connection will be established.
Nothing is perfect: tracking device's software may have bugs, it can use old firmware or command specification have errors – anyway, sometimes commands interface is not enough to figure out what's going on. For that case you can use terminal access to device using REST API! Just shift your TCP connection into terminal mode and data from device will stop to be parsed by channel. You can send data to device using REST API POST requests as if you are connected to device via telnet or serial port, and read accumulated responses data using REST API GET requests. You won't miss any byte of useful diagnostic data.
flespi Gateway API is positioned as a service for developers and we do our best to provide our clients wide set of various diagnostic tools. We hope that this will help you to build safe, fast and successful application that will change world for the better.