We receive more and more questions about integrating flespi with the MS Power BI platform, which is promoted as a great tool for data visualization and smart data analysis. We decided that it is a great opportunity to combine flespi as a backend with Power BI as a base for a Business Application.
Disclaimer: I have investigated the case of using Power BI for a very specific task: generating reports and dashboards for IoT telemetry devices. This article does not evaluate the entire Power BI functionality and contains only my personal experience from a developer’s point of view.
First look
What is Power BI? I can not explain it better than the guys from Microsoft did. My introduction to Power BI started with public materials and here is what I pointed out:
A huge amount of data sources. Regular files (like CSV or Excel), different types of databases and online services, a list of 3rd party data-collecting platforms.
Specific app source (kind of Application store) with ready-to-use apps either from Microsoft or from many other developers (my first thought was that I wanted flespi to be in this store).
Extended number of libraries to help 3rd party developers build solutions based on Power BI: create a custom visual, embed Power BI report to a web solution, SDK to create a server solution even with the possibility to lease server capacities.
At that moment I was excited like this,

so I could not wait to start exploring Power BI.
First try. Custom streaming data
So I create a Power BI account. (BTW, you can not just create a Power BI account with your personal (e.g. Gmail) account. Power BI will allow you to sign up only with your corporate email. A controversial decision, isn’t it?). Anyway, I register, create an empty dashboard, and try to add a simple tile. Three easy steps and I have an HTTP server to receive data from the flespi HTTP stream.
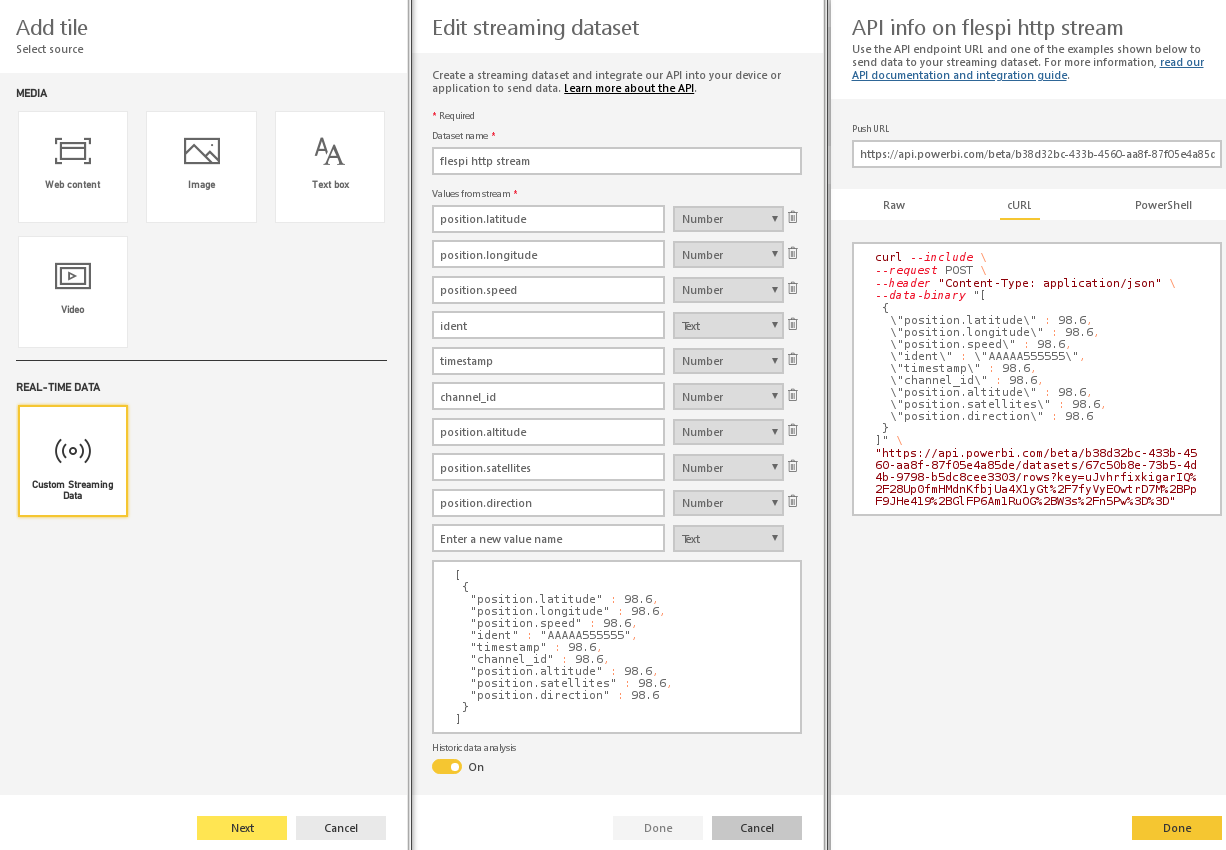
Power BI even shows me a curl request to emulate the data stream! The same way flespi REST API documentation does! I create an HTTP stream from flespi with one demo device sending 10 telemetry parameters every 10 seconds and start exploring the visualization stuff.
OK, guess how many visualization types they have for an HTTP API live stream? Five. No, I did not miss any zeros, not 50, not 500. Just 5. The first is a card with the live value. Then there are two clustered bar charts to visualize the difference between coming live values.
As I have telematics data in my stream it is useful to show something like a gauge card with the speed value. And here is another disappointment: to show a gauge in a nice way I need to specify min/max values. I can not do it manually — any configurational data can be taken only as a parameter in the incoming live data. Not good.
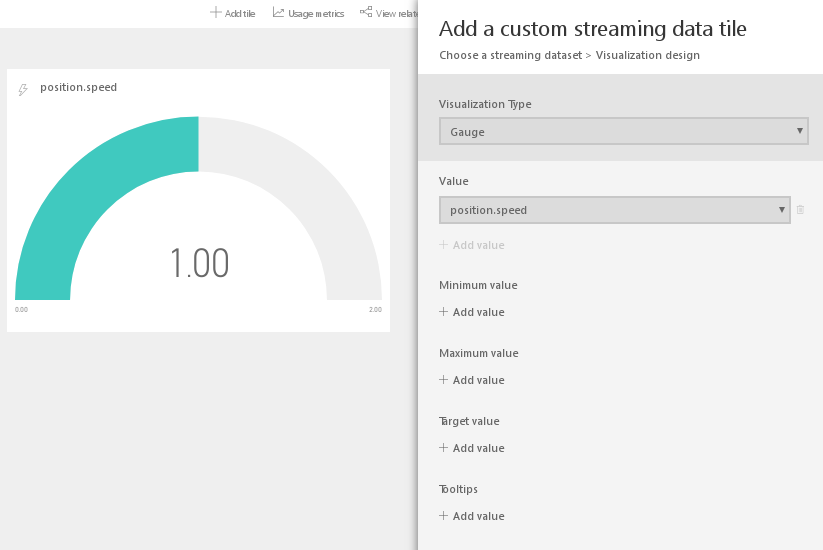
The last visualization type is a line chart. I am a mathematician, I like line charts. Let’s plot the speed of my test vehicle over the last five minutes! Right? Slow down, buddy. Here is what I got from Power BI.
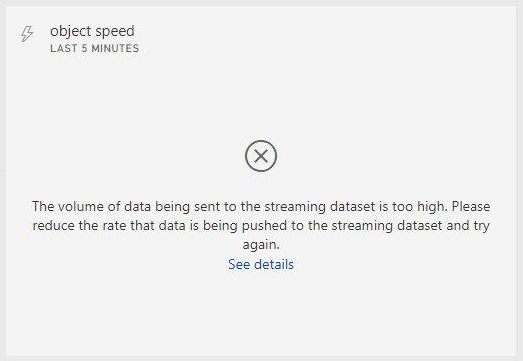
One message per 10 seconds for a period of five minutes is kinda 30 messages. I wait for the data to collect, refresh the page, reduce the number of messages in the stream, and see the following:
At this point, I understand that I will not see the line chart created from live data.

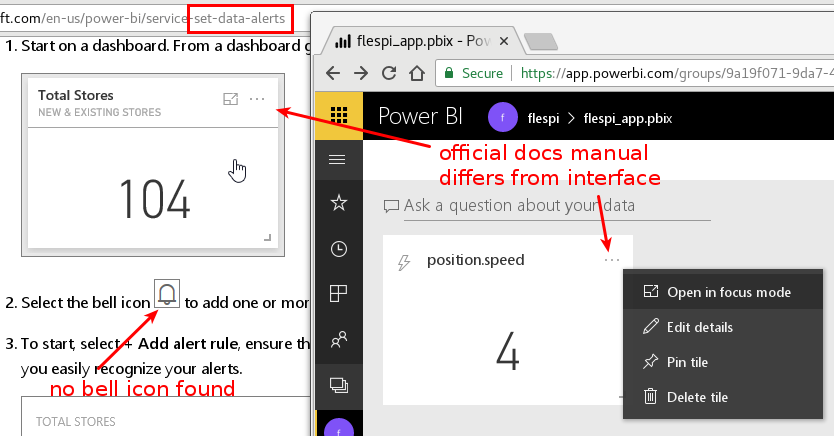
OK, maybe I can set up some kind of alert. I go to the official docs and find a 6-month old article with a detailed description of how to set up an alert. What do I see? I can’t do that:
But I don’t give up! OK, maybe this part of the functionality is under construction or whatever. But Power BI works with hundreds of data sources. Let’s work with static messages from some online database, and I don’t need to go far: just recently Nadzeya Masunova published an article that shows how to store flespi messages in Microsoft Azure Cosmos DB. It perfectly suits our IoT tasks. So let’s explore how Power BI can connect to it. (BTW, I tried to create an Azure account with a free subscription to repeat Nadzeya’s results. Somewhere this process went wrong and I failed to create Azure Cosmos DB and IoT Hub instances. This initiated my wonderful journey to the world of MS support, but this is the story for another article and here I use Nadzeya’s MS Azure account).
Second try. MS Azure Cosmos DB as a data source
Ok, I’ve got some data in Cosmos DB that I want to visualize via Power BI. The first step is to connect DB to Power BI. I click “Get data”, select Services and try to find Azure Cosmos DB among online services — no result. I select “Databases” — another disappointment. There are four available options and no Cosmos DB. And here is another interesting thing: to connect a database to Power BI one must install a desktop program. No choice:
Now once again and slowly. To connect the new popular cloud-based platform to an online database in 2018 you need to install desktop software. I looked at this like

Nothing to do. I want to help our partners. I have to show them the way to visualize their data from flespi. I have no choice and go to download Power BI Desktop. Do I need to add that Power BI Desktop is available only for Windows? Microsoft loves Linux? Not a Power BI story.

I am a Linux user, The last time I used Windows was the XP version. So I join the crowd praying Microsoft to publish a Linux version of Power BI Desktop and go ask our system administrator for a Windows laptop. No problems installing the Power BI Desktop, no problems connecting Cosmos DB to Power BI.
Useful tips to succeed with Power BI
For those of you who bravely decide to feed flespi telemetry data to Power BI following are some tips that may help build some visualization stuff.
Define the column type. As soon as Power BI pulls data from Cosmos DB you will see the messages from flespi in a table view: each JSON key corresponds to a separate table column. By default, each column has a text format. It will not allow you to use cell values to plot numeric line charts.
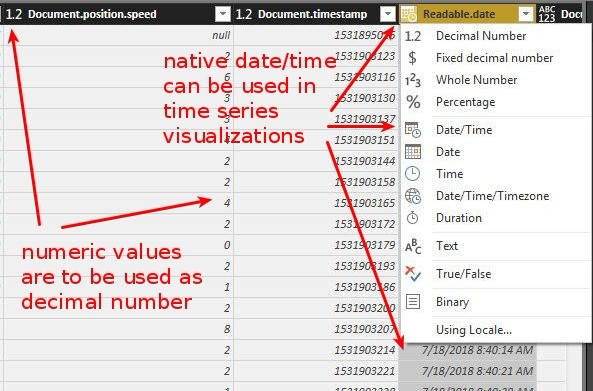
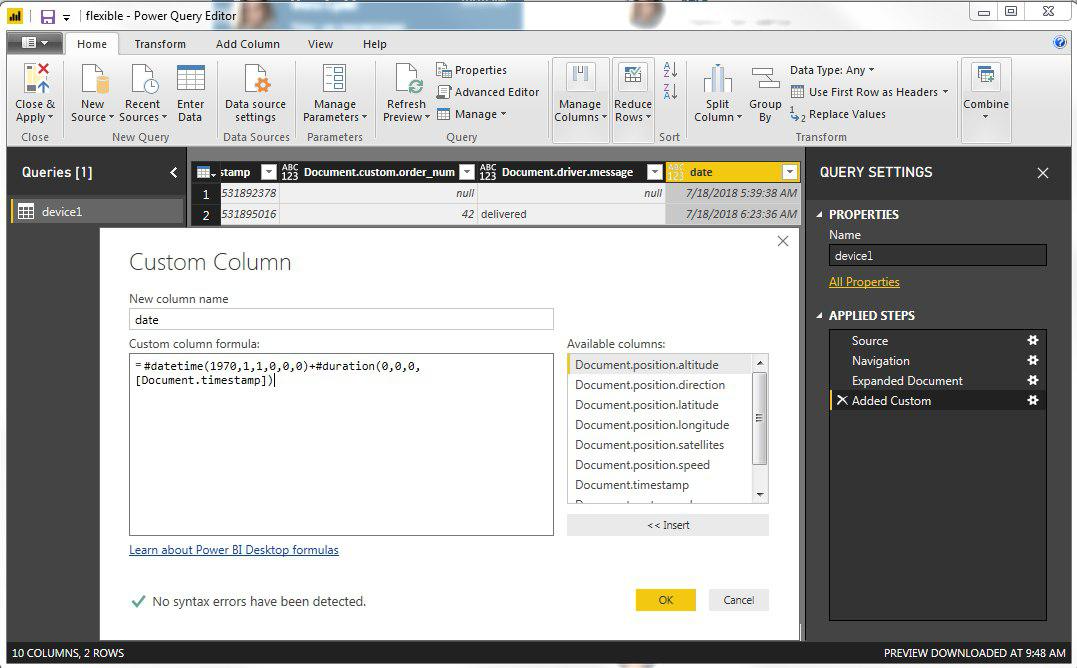
- You can create custom columns. E.g. each flespi message arrival time is defined by a UNIX timestamp. To convert it to a readable date and time just create a custom column with the following value
#datetime(1970,1,1,0,0,0)+#duration(0,0,0,[Document.timestamp])
- All default widgets are clear to use so you can easily create visualizations like this: points on the map, a card with the last message from the driver, and a line chart of the speed, etc.
- Here is the ready-to-use example. Just change the data source credentials.
Syncing project data
If you want to see your project in the cloud, you have to publish it in the workspace. So I publish my project and see it in the cloud the same way as in the Desktop software. As soon as I have live data from my demo device I want to update my report with new values from the database. I push the “refresh” button — nothing happens. I go back to Desktop software, sync online database again, publish data to the cloud again, and see the following:
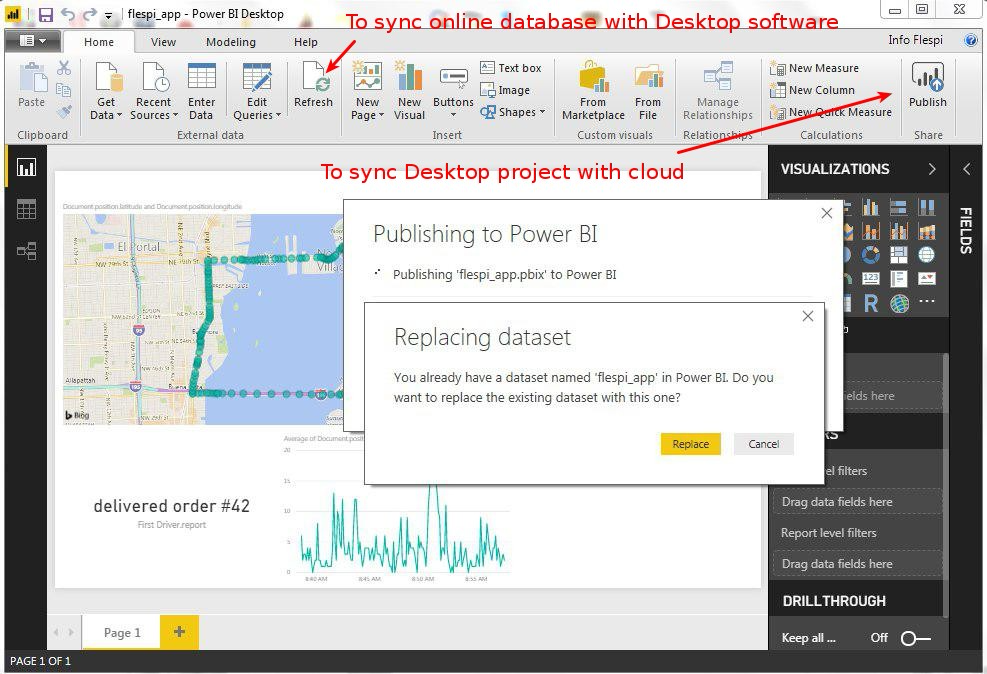
What? Do you want to replace a dataset? Really? Once again and slowly. To update my report on the cloud platform with new values from my online database (both produced by the same company) I need to download all data to my (Windows only) computer and upload it to the cloud manually.

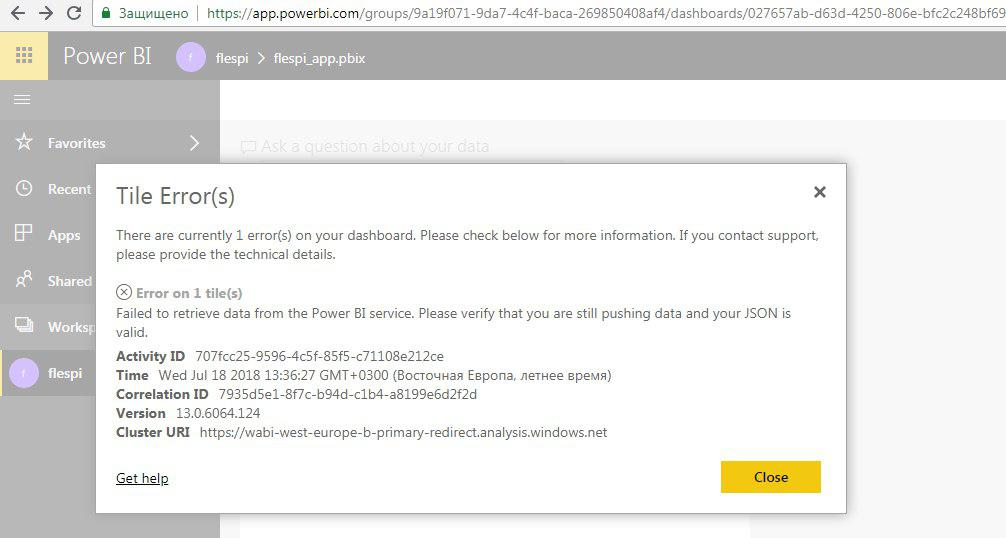
It can’t be so and I go to find some automatic update, or scheduled refresh or whatever. What do I find?
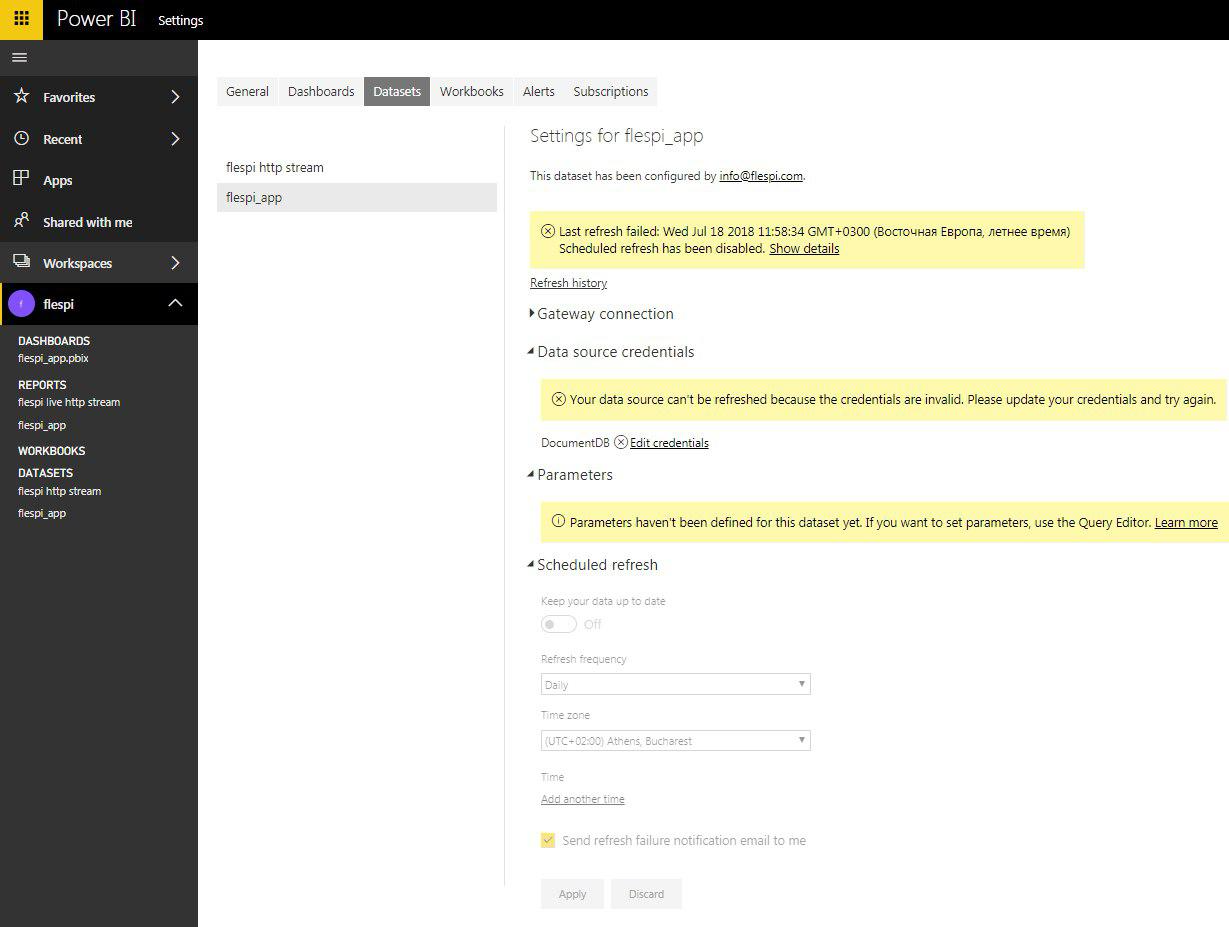
Scheduled refresh is just muted. The last manual refresh from the cloud failed. Credentials are invalid. I have seen a lot of things in my life, but this is too much.
Conclusions... and the aftertaste
Power BI does not work well with live data. Which makes it not the best solution for IoT dashboards and reporting system. I’ve described the way to connect it to flespi through the MS Azure cloud, and it can be used for some tasks. I faced errors, documentation mismatch, irrational architectural points, complicated online interface. I am not sure that I would recommend our partners to use this platform. If my conclusions do not sound right to you, please email me at baja@gurtam.com, I’ll be glad to discuss it.
And my experience of communicating with Microsoft tech support deserves a separate article. So stay tuned.