Articles on our blog are as clear as possible. Every string in documentation is absolutely concise. All pages at our site are completely informative. At least I hope that’s just the way it is ;) But what if you don’t have enough time to explore all that stuff? What if interaction with the platform is not (impossible!) as clear as I thought? This post will tell you about flespi gateway in the show-and-tell mode: simple steps, perceptible screenshots, and fast results — nothing more.

Ok! Let’s assume that somehow you have found your path to flespi.io: from this site, by invitation letter, or using this link here. Anyway, the good thing to know is that flespi.com contains descriptive information, while the gateway platform by itself is hosted under the .io domain.
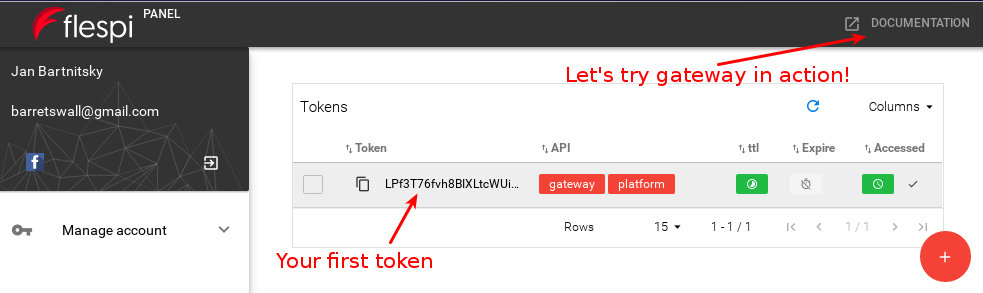
flespi.io meets you with a login screen where you can use one of your social media accounts to authorize on gateway platform. After authorization, you will find yourself on the Personal account page where you can edit your account information and manage your authorization tokens. You can read about tokens in more detail at the API guidelines page. As for now, you need to know that you’ve been provided a token allowing you to try flespi gateway in action: hit Documentation link on the top right corner.
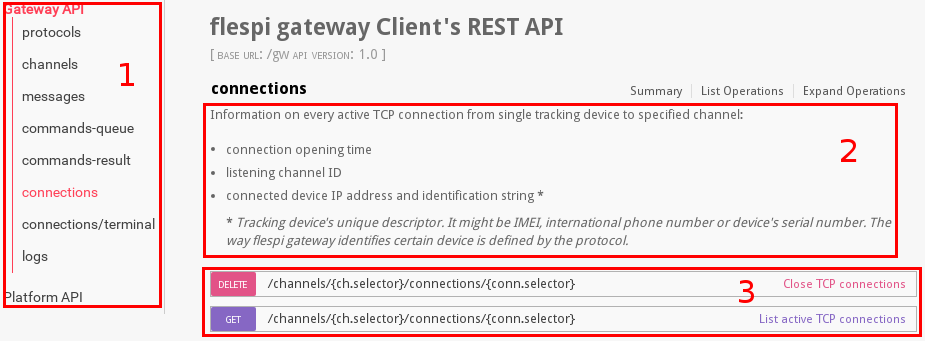
flespi documentation is built with the swagger framework. Thus, our documentation is interactive: it allows not only to review available REST API methods and its specifications but also to construct an API request in UI mode, send it to the platform and view the result. Documentation page consists of the following structural parts:
- Navigation tab to switch between entities.
- Description field for the selected entity.
- Available methods to manipulate entities.
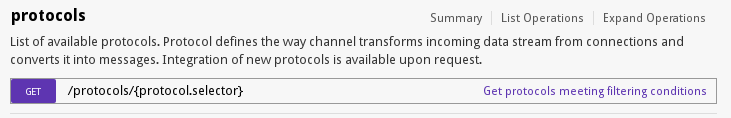
Let’s construct and perform a request to the flespi gateway. At first, we need to know what protocols are currently supported by the platform. Click “protocols” link on the navigation tab: there is only a “GET” REST API call to be performed.
Click on the request frame to expand it and take a look at the “Try it out!” button.
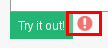
Note an exclamation mark on the right side of the button. By clicking on it you will be prompted to authorize the session with the platform:
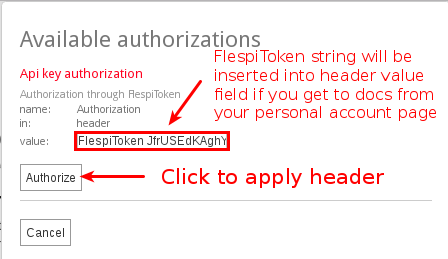
This step is to be done only for the first request to the gateway during the current session. Now your requests are authorized and you can click on the “Try it out!” button.
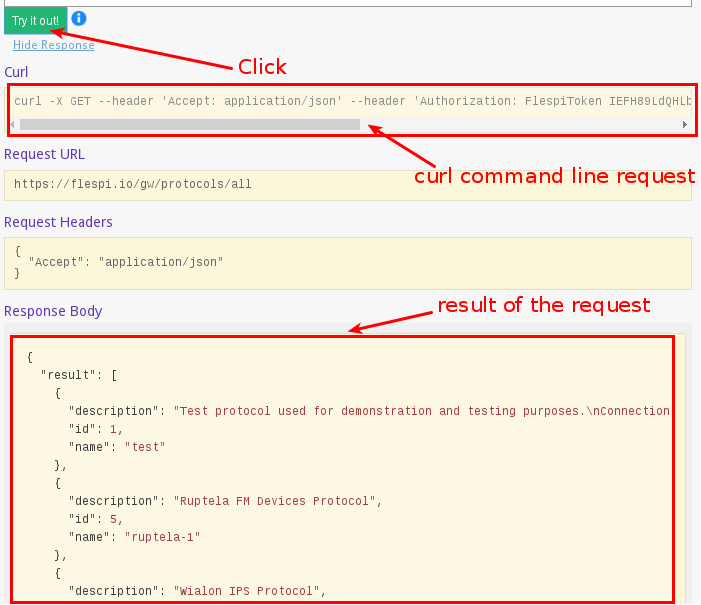
The result of the request appears in the lower section. There is also a curl command line request that can be performed right from the terminal:
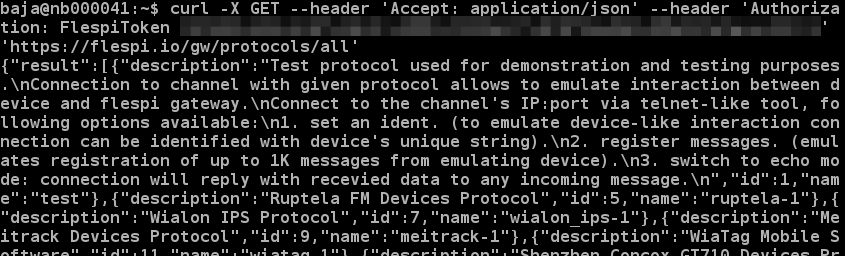
The core info for us here is that we are going to use test protocol with id=1 to create our very first channel to touch gateway features. As specified in the protocol description:
Test protocol is used for demonstration and testing purposes.
Connection to a channel with a given protocol allows to emulate interaction
between a device and flespi gateway.
Connect to the channel's IP:port via telnet-like tool with the following options available:
1. set an ident
(to emulate device-like interaction connection that can be identified with device's unique string).
2. register messages
(to emulate registration of up to 1K messages from the emulated device).
3. switch to echo mode:
connection will reply with received data to any incoming message.
So here is our plan:
- Create a test channel. The channel will provide us host:port on flespi server.
- Connect to the host:port provided via telnet-like tool and emulate a real tracking device.
- Check the connection between the platform and the “device” via GET /connections request.
- Receive messages from the device via GET /messages request.
- Send a hypothetical configuration command to the device.
- Finally, close the connection via DELETE /connections and see logs of our actions.
Let’s do it!
1. Create a test channel
- click on the “channels” link on the navigation tab
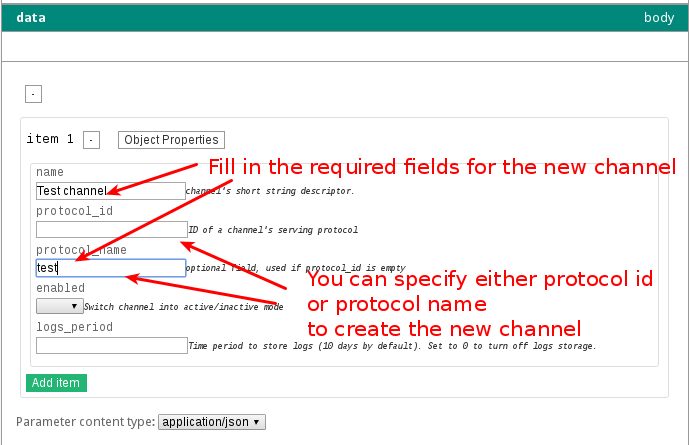
- expand POST/channels request
- in “data” section fill the “name” and “protocol_name” (test) fields
- click “Try it out!” button
In “Response Body” section you will see something like this:
{"result": [
  {"enabled": true,
  "id": 90,
  "logs_period": 10,
  "name": "Test channel",
  "protocol_id": 1,
  "uri": "193.193.165.37:20017"}
  ]}
The most valuable stuff for us here is that a new channel has started to listen for new connections on 193.193.165.37:20017.
2. Emulate connection to the channel created
- connect to 193.193.165.37:20017 via telnet-like tool
- enter 1 and set the emulating device identification string
- enter 2 and register several messages
- enter 3 to switch the channel into echo mode
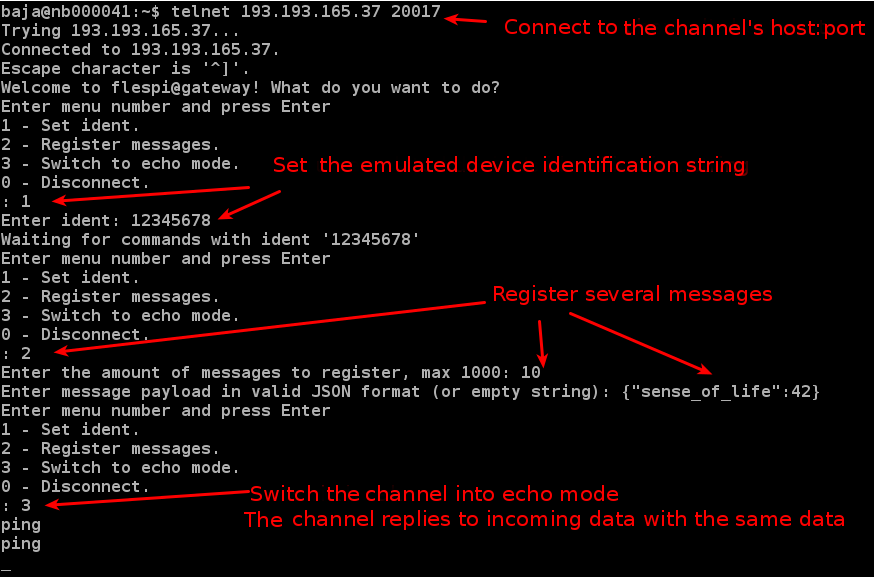
The result of the actions described above is that we have created a channel with a test protocol and registered 10 messages from the “device” with ident=12345678. Let’s check it with REST API calls.
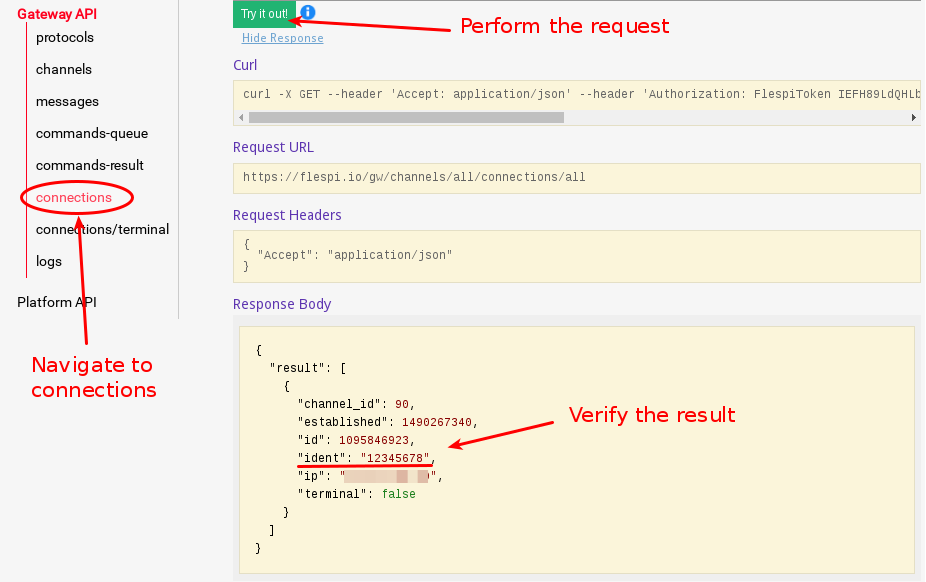
3. Check the connection
- go to the Connections page using the navigation tab
- perform GET request to all channels for all connections
- verify that the device with a given ident is currently connected
4. Get messages from the device
Go to the messages tab and expand the GET request frame. You might notice the ch.selector frame just above data parameters.
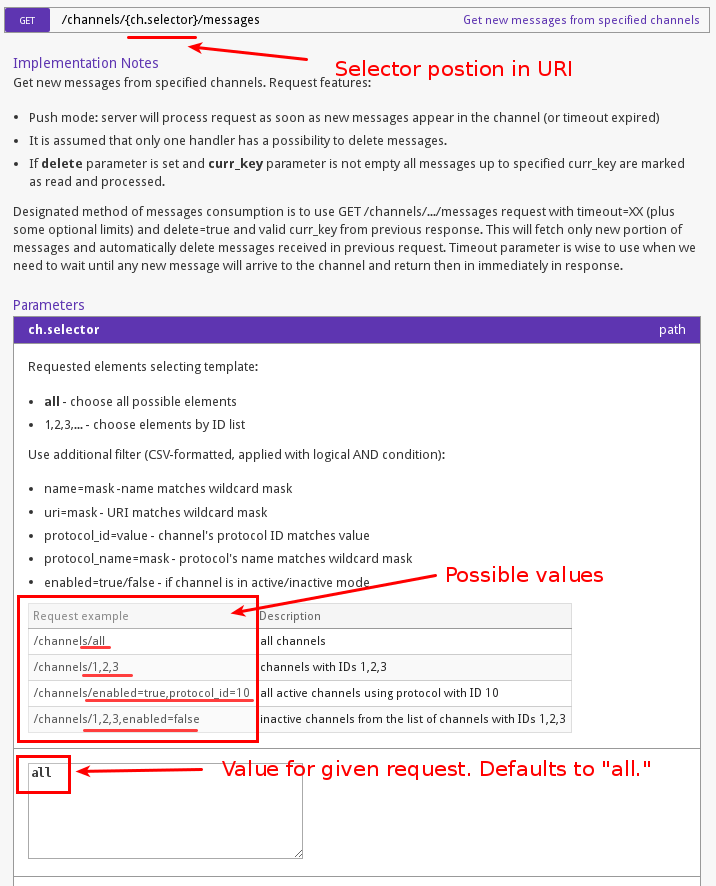
This parameter is used to specify the channel being targeted with a given request. In our case we have only one channel (created on step 1), so we don’t need to change the default value. But keep in mind, that the request sent to all channels specified in {ch.selector} field may cause unexpected results. See API guidelines for more information about selectors in particular and about API requests in general.
Click the “Try it out!” button to see all messages registered by the emulated device.
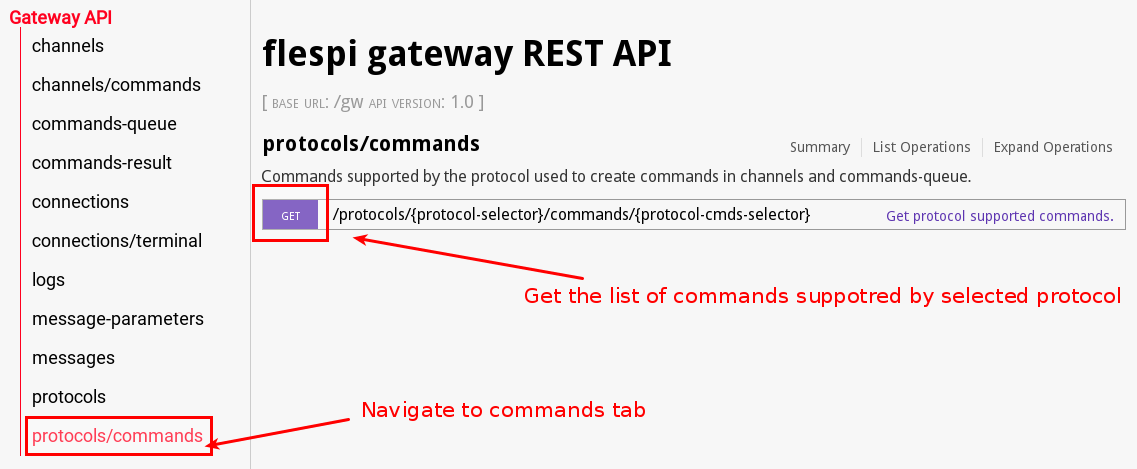
5. Send a command to the device
Before we send a command to the connected instance lets find out what commands are supported by the test protocol. Navigate to protocols/commands tab and perform GET request (don't forget to specify protocol ID in the protocol-selector field, or “name=test” to avoid seeing commands from uninterested protocols).
The result of the request would be a list of commands like that:
    {
      "description": "Pass properties of any type",
      "name": "custom_msg",
      "properties": {},
      "title": "Message with custom payload",
    },
    {
      "description": "Force device to update its position and report it to the server",
      "name": "query_pos",
      "properties": {
        "force": {
          "type": "boolean"
        },
        "period": {
          "type": "integer"
        }
      },
      "required": [
        "period"
      ],
      "title": "Query position",
    }
The first command can be used to send properties of any type. The second one is an example of a specific command that can take only boolean “force” property and must have an integer “period” property (and the command will not be sent if verification is not passed). We are going to try to send query_pos command:
- navigate to the commands-queue tab
- select POST request to add commands to the queue
- specify the device's ident, where a command is to be sent
- add object properties “period” and “force” and click “Try it out!” button
“Expires” parameter means a command lifetime. If a device with the specified ident is not connected to the channel specified by {ch.selector} the command will be stored in the commands queue until “expires” moment (UNIX timestamp). The command from the queue is sent to a device with the given ident as soon as the device connects to the channel and registers its ident. Commands (sent and expired) are pushed to the commands-result list and can be reviewed via GET /commands-result request.
Hint: the process of adding command parameter
- Click on the “Object properties” button. A drop-down area with a prompt to write a property name will appear.
- Fill in the “property name” field and click on the “Add” button.
- An area to fill in the new field appears. Select the type of the new field.
- Fill in the “value” field of the new command parameter.
- An added parameter is now stored in the object properties list. You can repeat the steps above to add other object parameters.
6. Close the connection
From the gateway’s side, the test connection can be closed using DELETE /connections request.
We can review all the actions using GET /logs
{
    "result": [
        {
            "channel_id": 90,
            "event": 1, -- this means that connection established
            "ident": "",
            "source": "my.ip.address(TCP)",
            "time": 1490621734.424669
        },
        {
            "channel_id": 90,
            "event": 14, -- connected device successfully identified
            "ident": "12345678",
            "source": "my.ip.address(TCP)",
            "time": 1490621738.646343
        },
        {
            "channel_id": 90,
            "duration": 71,
            "event": 3, -- connection successfully processed and closed
            "ident": "12345678",
            "msgs": 10,
            "recv": 45,
            "send": 589,
            "source": "my.ip.address(TCP)",
            "time": 1490621805.458442
        },
        {
            "channel_id": 90,
            "event": 1,
            "ident": "",
            "source": "my.ip.address(TCP)",
            "time": 1490621843.403226
        },
        {
            "channel_id": 90,
            "event": 14,
            "ident": "12345678",
            "source": "my.ip.address(TCP)",
            "time": 1490621846.789199
        },
        {
            "channel_id": 90,
            "command_id": 239,
            "command_payload": "{\"restart\":\"now\"}",
            "event": 13, -- command successfully executed
            "ident": "12345678",
            "source": "my.ip.address(TCP)",
            "time": 1490621846.789199
        }
    ]
}