Ten years ago, when we were developing the flespi architecture, I could not even imagine a moment of a complete power outage at the data center. Based on a decade of uninterrupted power supply experience when we were operating the Wialon data center in Groningen (Netherlands), I would have never believed such a nightmare would happen to us.
Design for reliability
When we designed our database system for telematics data storage, it was engineered accordingly. We made it super quick with an in-memory cache, but with degraded reliability in case of unexpected power loss, server, or drive failure. So, to increase reliability, we have set multiple mirrors of the data on different servers located in different racks and even in different data centers. Later, we backed it with persistent storage snapshots.
We keep 3 to 4 database mirrors with the same data. When a drive or power failure occurs on a database server with telematics data, we automatically find a spare database server and start data synchronization from the unaffected mirror. For safe distribution, the database system automatically tries to distribute mirrors between data centers or place them in different racks when multiple mirrors are created in the same data center.
To cover every possible negative outcome and even prevent them, we’ve designed two solutions.
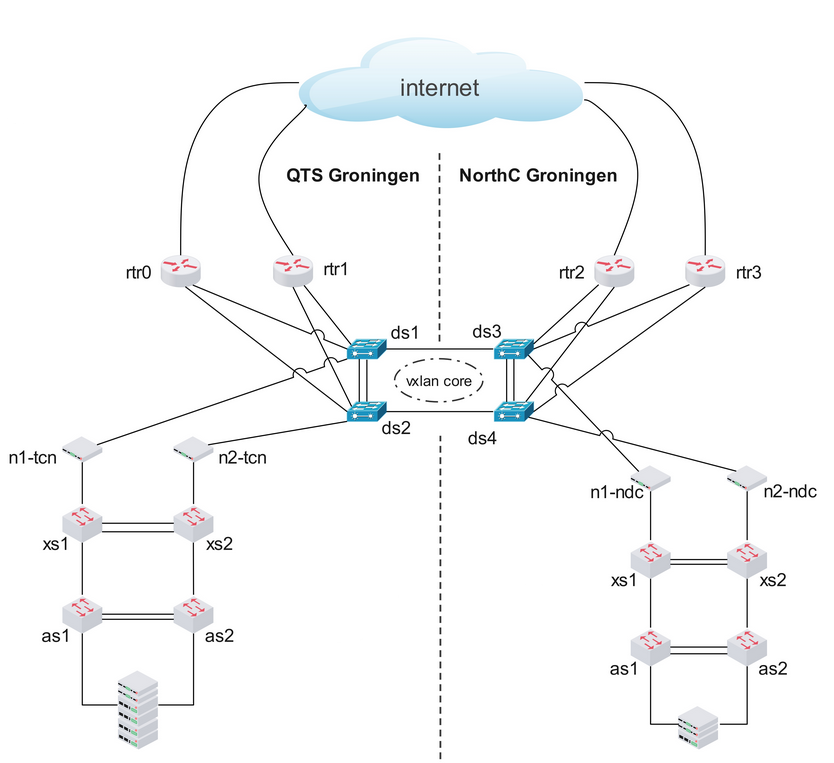
The primary solution is to have two data centers with all services mirrored. In case one of the data centers has problems, we can safely operate from the other data center, with minimal downtime – hopefully.
The secondary solution is that we have persistent offline data snapshots, which we make at least once per day. They are stored in the filesystem in an archived form and will survive even a nuclear explosion. However, restoring all terabytes of data from snapshots will take, I suppose, at least a day – maybe even a few.
The primary solution, in which we have two data centers simultaneously servicing users, is not only a backup solution in case of catastrophic disaster recovery but also a normal operating mode. Each data center has its own set of IP addresses for REST API, MQTT Broker endpoints, and channel IPs to which you connect devices. All these endpoints are automatically resolved into multiple IP addresses that are located in two data centers, and your requests and device connections usually jump from one data center to another in a round-robin fashion.
Everything is configured to survive, but still, no real data center failure has happened to us yet. Until last week.
I could imagine that we would lose a server; sometimes, this happens. I could even imagine that, due to human error, the whole rack in the data center would lose power. But I didn’t even think about a complete data center experiencing a blackout. This was a real nightmare...
Incident timeline
On Wednesday, April 2, 2025, on-site engineers at the data center from which flespi operates performed scheduled maintenance on one of the power feeds. Our racks have redundant power feeds and are designed to switch between the power feeds without affecting rack equipment. Fortunately, this doesn’t happen often, but it does occur a few times a year.
The information about the scheduled maintenance was available to our infrastructure provider, but our team was not aware of it. So, for us, it was a perfect sunny morning – one of those spring mornings when you finally enjoy the weather after a cold and dark winter.
At 08:50 EET (it was 06:50 GMT; from now on, I will specify the time using the local Vilnius time zone), our infrastructure provider received a message from their monitoring system that power feed redundancy had been lost. This was the expected notification. At 09:00, they received a message that the equipment was inaccessible in the data center. This marked the start of the incident.
Let me remind you that our team was unaware of the power feed maintenance, and the very first notification message we received came directly into our SRE group chat at 09:00:09, with the information that flespi was unavailable from two remote locations. The notification message was generated by our uptime-controlling and downtime-reporting system.
09:00:21. We started to receive mass notification messages from our services management system, located in another data center, about disconnected services. All these disconnected services were of different types and located on different servers, but they had a common data center location, which made it more or less clear that we had a problem with the whole data center.
09:01:22. More than 50% of remote uptime-controlling nodes were reporting downtime, and the global flespi downtime had started automatically and was reported to our NOC.
09:02:25. We reported the data center problem to our infrastructure provider.
At that moment, our team understood that we had lost a data center and began recovery actions. At 09:03, we started reconfiguring the flespi.io domain name zone to remove IP addresses for the failed data center from resolving. The DNS server reconfiguration took a few minutes due to the stress and pressure. We keep a 5-minute TTL for NS records specifically for such cases. So, our expectation was that in about 5 to 10 minutes, the majority of traffic would switch to the live data center, and we would take care of the offline one.
09:07. Our infrastructure provider acknowledged the incident and reported that they were investigating.
09:09. Another internal monitoring system, Zabbix, started spamming us with notifications that our servers in the data center had been unreachable for 10 minutes.
09:15. We published an update to the NOC, stating that the problem was related to the connection between data centers and that our team was working to resolve it.
At that moment, DNS records had already propagated to name servers worldwide. At 09:16:46, at least 50% of our uptime-controlling nodes had restored their uptime status, and we had an official end to the flespi downtime, which was automatically published to the NOC. Its duration was recorded as 944 seconds (16 minutes), and basically, this is the time it took us to recover from the data center failure in manual mode for the very first time.
However, this was just the beginning.
Devices reconnected and started pushing messages from the black box. Users and automated systems increased the load on the remaining data center by pulling tons of data to investigate the current state. So, instead of normal operation at double load, we experienced a spike in load by an order of magnitude higher. Still, it should have taken 5–10 minutes more to handle this increased load on the remaining half of our servers' capacities.
Due to the increased load, we started to experience short downtimes: 33 seconds starting at 09:19:56 and 41 seconds starting at 09:20:47. Such short downtimes, when our uptime-controlling nodes fluctuate around 50% availability, are a good indicator of increased load and were more or less expected.
09:21:45. The fourth downtime started, and from that moment, the load on the platform was so high that messages passing from devices in channels constantly had a small delay, from a few seconds up to a minute or two. The uptime-controlling system requires latency since data sent by the simulated device is received via MQTT and REST API calls in less than 5 seconds.
So, we were constantly down from this point of view, although the majority of our users were able to remotely operate devices, receive messages, etc. The flespi REST API to the database system was relatively slow to respond. Internally, we considered activating additional service nodes to add more resources. However, the CPU load from ingestion services and the pipeline started to decrease, so we decided to wait a bit.
09:28. Our infrastructure provider gave us the initial explanation of the incident. At that moment, and since 09:21, we had been in a continuous downtime state. However, flespi was still accessible by the outside world though a little bit slower than usual.
09:33. flespi became inaccessible even for us. We were completely cut off from the Internet.
09:34. We reported to our infrastructure provider that our second data center was completely offline.
09:37. The problem was acknowledged by the provider. Also, at that time, the power supply to the servers in the failed data center was restored, and they all started to boot. However, we were unaware of this at that moment.
09:41. The Internet connectivity of the remaining live data center was restored. We suspect that this disconnection was due to network reconfiguration by the provider, whose equipment operation was also partially affected by the data center blackout.
So, all in all, the exact period of flespi unavailability was from 09:33 to 09:41 EET.
Less than 10 minutes.
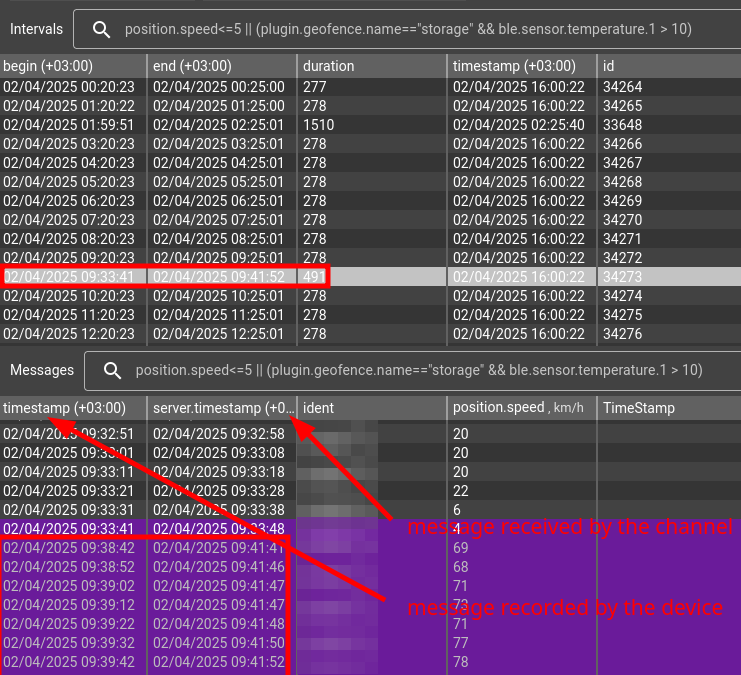
This is the exact time period when nothing worked. Before and after this time, all systems operated but with an increased load and not as smoothly as usual. Later, I created a calculator with a device inactivity detection selector, configured it to detect 60+ seconds of latency in data reception, and checked a few simulated devices that regularly send messages to flespi. Only this time window was detected as the device inactivity period, and I think this is pretty cool.
Back to the incident postmortem. Once the Internet connectivity was restored, we received another spike in load. However, at 09:41, we received the first notification message from the initially blacked-out data center and decided to bring services back there instead of activating extra application nodes in the live one.
We waited for a few minutes until all servers were powered up again. At 09:45, we disabled automatic mirror synchronization in the database system to prevent overwhelming the network bandwidth capacity of our link between data centers.
09:47. We started launching the services. First, it was the database mirrors (we call them mdb nodes) with database REST API services (mdbapi), followed by the MQTT Broker (mbus nodes), and all other key services afterward. We did it smoothly in controlled manual mode to manage the impact.
09:53. Started synchronizing the telematics data mirrors in the blacked-out data center with the data from the active one.
09:57. The exceeded load was more or less mitigated by our services, and the long 2,238-second (37-minute) downtime was finally over. However, the load was still high. We again started to suffer from multiple short downtimes (55, 25, and 24 seconds).
10:02. We published one more update to our NOC, stating that the system was more or less settled, working under higher-than-usual load, and we were slowly bringing the blacked-out data center back to life.
It took exactly one hour to mitigate the data center failure, which is not that bad, actually. The only not fully operable system was flespi analytics, as the nodes were slightly restoring the message cache from the database. This system is kind of a secondary one and does not influence our uptime/downtime status due to the nature of its data processing.
10:33. All our major services were started in the second data center, and we decided to make it available to users again. We wanted to distribute the load between two data centers, as some services in the live data center were running at the peak of their capacity.
10:35. DNS service configuration has been restored to resolve our domain names into IP addresses of both data centers.
10:40. We received another rather long downtime that lasted for 254 seconds. There was no clear indication of where the problem was at that time. At 10:43, we received one more downtime lasting for 761 seconds (12 minutes). However, coinciding with the second data center activation by DNS looked very suspicious, so we decided to reconfigure the DNS system back to the IP addresses from a single data center.
10:48. Finally, we’ve discovered that the router services in the failed data center had received a brain split, and both were trying to serve public IP addresses.
10:51. We restarted the heartbeat process on the secondary router, which eliminated the brain split between the two routers and restored normal operation of the data center routing system.
10:51. All our uptime-controlling nodes cleared the alert, and we were back up. After one more short downtime, we finally ended at 10:51 with a normally functioning platform.
10:55. After various tests, the DNS system has been restored back to the original configuration, resolving our domain names into IP addresses from both data centers. All services were restored; however, we still had to synchronize around 80TB of data into the second data center to restore durable storage and localize data access operations.
11:00. Our team was able to drink the very first cup of coffee since the beginning of the incident. Meanwhile, the database mirrors synchronization process was running safely in the background, restoring storage copies in the failed data center.
11:52. Suddenly, we received one more downtime for the next 157 seconds. The reason was the storage nodes synchronization of a so-called asynchronous batch queue system that backed up message queues for channels, streams, and MQTT Broker sessions storage. This system, during the synchronization of large storage items, such as channels with 10GB of messages in the queue, may freeze write operations for its neighboring items. This was quickly resolved by canceling the synchronization of such nodes and continuing with different types.
12:30. We published the outage details into the NOC, outlining our current status and the next steps we would perform. At that moment, our monthly uptime had plunged to 99.82%, similar to the U.S. stock market value after Trump announced wide import tariffs.
Our Enterprise and Ultimate plan subscribers benefit from our automatic compensation SLA: Ultimate plan customers receive a 70% discount on their flespi services invoice if monthly uptime falls to 99.89% or below, while Enterprise plan customers receive a 30% discount when uptime ranges between 99.01% and 99.89%, reflecting our commitment to service reliability and fair compensation for any disruptions. Since our monthly uptime was already slightly below the watermark, we applied the discounts to their invoices, wiping out around 10% of our monthly revenue.
Since we were already at a low uptime number, we decided to finalize the synchronization of these asynchronous batch queue nodes and received one more, now a controlled 1133-second downtime. I believe not many users noticed it because the only effect was higher message latency at certain moments and for certain channels. It was no more than one minute but above our acceptable standard (5 seconds). We explained this process in the NOC and let it finally finish.
The entire data mirrors were synchronized to the failed data center within two days of the incident, and now we are running the fully fault-tolerant platform again.
Observing the load
After the incident was resolved, it’s interesting to take a look at the system load charts to understand how we can improve incident handling in the future.
The first series of charts covers CPU resource usage. I'll share the charts for a couple of randomly selected nodes.
The first significant spike in CPU usage was observed for the services responsible for channel data ingestion:
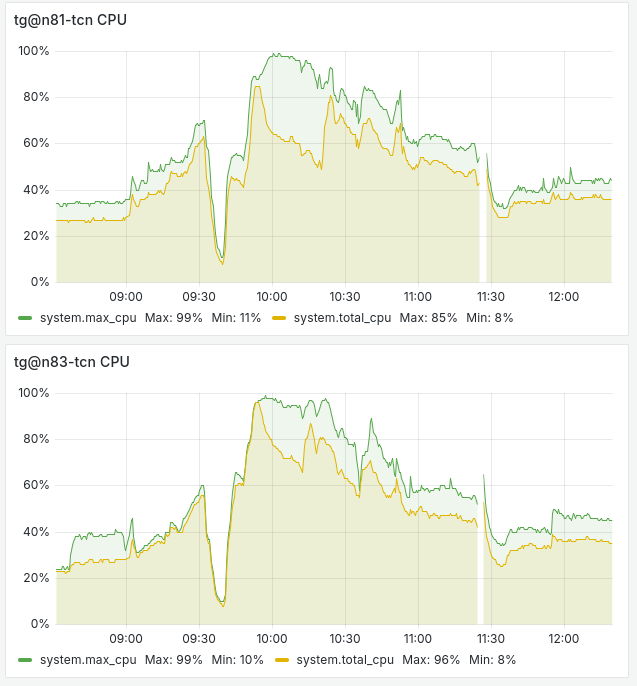
However, this load was quickly resolved and passed on to the MQTT Broker, which was handling both external and internal MQTT sessions:
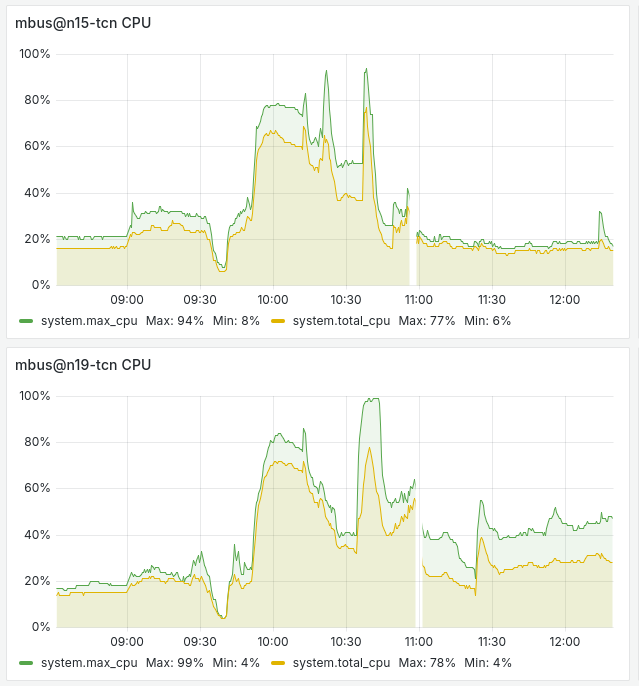
We reached CPU load peaks on some services and even had to restart the MQTT Broker services to rebalance active MQTT clients between brokers.
However, the highest load was on our database system, specifically its REST API subsystem. It was handling the load from hundreds of flespi analytics system nodes that automatically started acquiring messages from devices that were previously managed by the analytics system nodes of the failed data center:
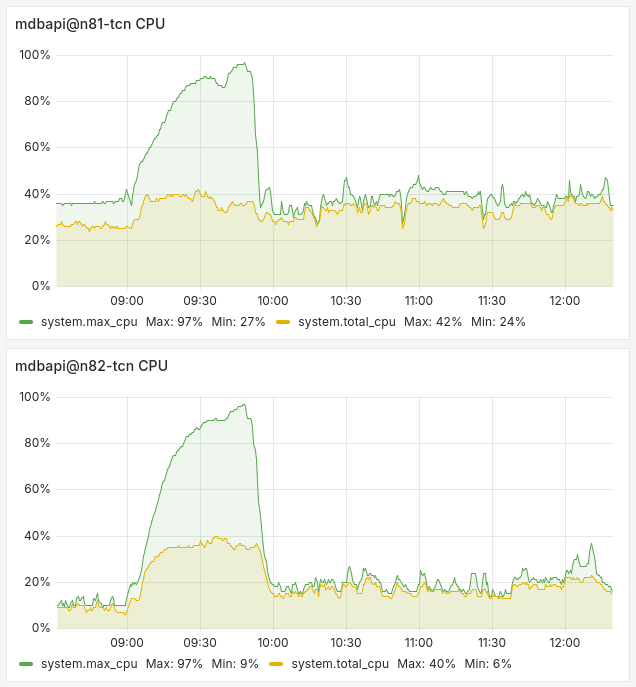
It seems that the load had accumulated due to queued messages for the disconnected database mirrors. Once the blacked-out data center servers restarted and nodes reported their recovery, the CPU load from the database REST API service effectively dropped. However, efficient frozen operations queue management could be an area for future optimization.
All other parts of our platform were almost unaffected. The only exception might be the streaming services responsible for pushing data out of flespi, which experienced some extra load for a while:
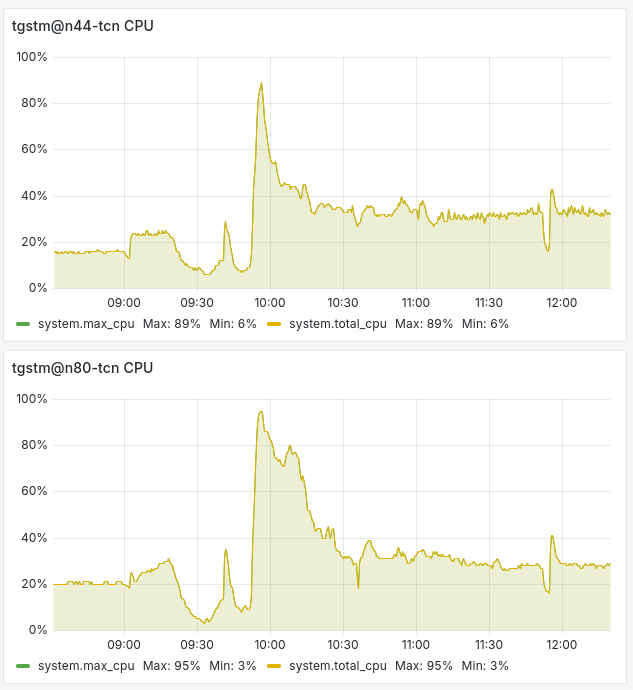
As you can see from the CPU load charts above, nothing critical occurred.
The network connection between data centers, with a 10G capacity, handled the load without issue. Below is the bandwidth chart for vlan 558 on both routers in the failed data center. You can see when the data center was operational, when it was offline, and when we manually switched the routing system to eliminate the brain split:
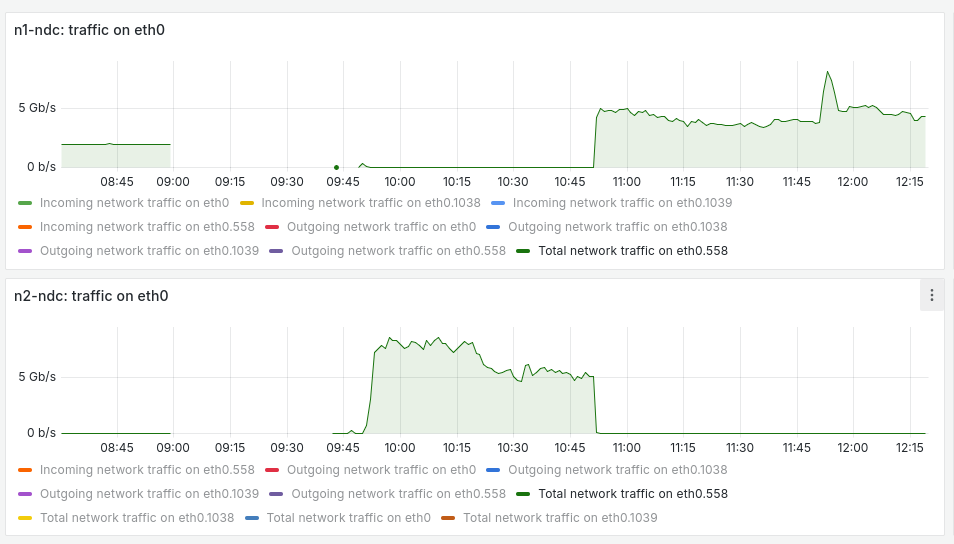
However, if all the mirrors had started their synchronization at once, it could have overwhelmed the available bandwidth. To prevent this, we've already implemented a protection mechanism in the database system management service, which ensures that only a limited number of nodes synchronize at any given time.
Lessons learned
A wise person always learns from their own mistakes, but it's even better to learn from others' – though that often depends on luck. Regardless, every mistake presents an opportunity to improve. And that’s exactly what we’re doing: we've already implemented several improvements in how we handle data center failures, with more on the way in the near future.
The first lesson we learned is that data centers can suffer from power outages. Even in the Netherlands.
The second lesson is that we need some scripts to automate system reconfiguration between data centers. Maybe not fully automated like we have with gateway routers, but a simple script to enable or disable domain name resolution for data center IPs. This will make it much easier to control traffic and load. This is part of our technical debt that we didn’t fully implement when we activated the dual-datacenter setup.
The third lesson, which is already implemented, involves updates to our telematics database system, making it much more resilient under harsh conditions. Last week, we upgraded the system to synchronize asynchronous batch queue nodes without significantly affecting users. We also installed a range of improvements to handle critical loads more effectively. Less than a week after the incident, we’ve optimized the database system, and unless the next big incident comes along, it’s good to go.
The fourth lesson is that we need to maintain more spare resources for certain services – not just to handle their regular load but also the additional load from a second data center and any peak load that happens post-failure. We’ve shifted our approach to running services at 20% of their real throughput capacity, whereas before, this was set to 40%. Essentially, we’re planning to double the resources allocated to services to handle the excess load.
And finally, the fifth lesson, which I’m particularly proud of, is the way our team handled the entire situation. Surviving a catastrophic data center failure is a massive achievement, and I believe we responded exceptionally well. While our monthly uptime took a significant hit, the actual platform outage lasted only around 30 minutes. The remaining downtime was automatically reported due to the system operating below our quality standards only.
And finally, my sincere thanks to all our users for sticking with us during the incident. With over 5,000 users on the platform, we did get a few minor inquiries about increased latency in channels or streams, abnormal device disconnects, and issues with data-consuming applications – all perfectly reasonable under the circumstances. I genuinely appreciate the transparency we aim for in our operations and the patience and understanding you've shown. Thank you!
It’s also worth mentioning that codi, our AI Assistant, played a crucial role during the incident. Equipped with all the information from the NOC and capable of monitoring network latency and uptime, codi flawlessly responded to incoming inquiries about the incident details and expected resolution time. It answered all similar questions in under a minute, saving our engineers energy and time to focus on resolving the issue.
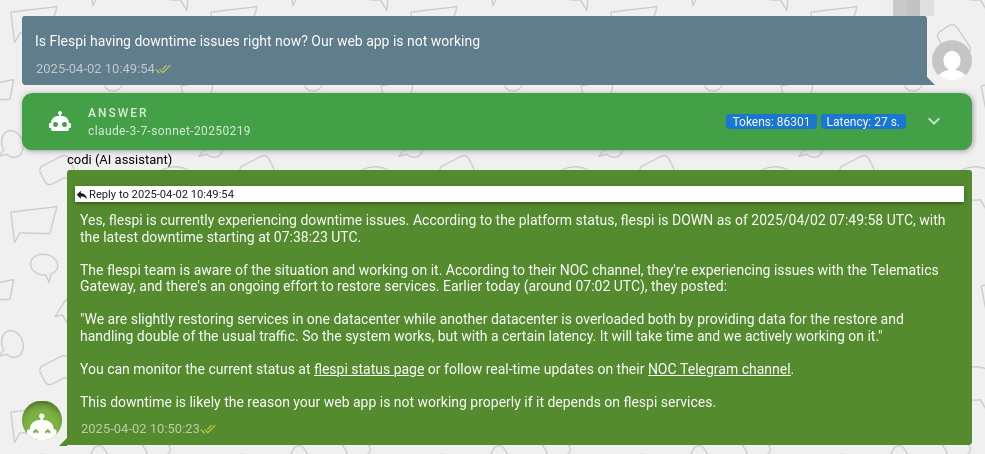
When we first connected codi to the NOC status and provided network and uptime testing tools, we never imagined it would be right there with us during such a catastrophic recovery. But when the incident hit, the AI performed beyond expectations. I’m truly proud of it. On top of that, codi upgraded two accounts to the commercial Start plan on the very day of the outage. So, while we were focused on handling the recovery, it continued to do its job without missing a beat.
What doesn’t kill us makes us stronger – and we’re definitely much stronger now. There’s more to come in the future. My sincere apologies for this incident, and my immense gratitude to you, our amazing flespi users, for your understanding, support, and patience!