In the recent article, we’ve already talked about our desire to automate parts of the interface and about the FormBox form generation utility. This time we are dedicating our story to another similarly simple utility.
Maps everywhere
As flespi is called to facilitate the developer’s interaction with the telematics data, it would have been weird if we hadn’t created MapView. MapView is a plain tool for displaying the map and various elements such as Marker, Polygon, Circle, Polyline. The utility grounds on Leaflet — an open-source JavaScript library for drawing maps — and the OpenStreetMap map tile. It can also handle the Google Polyline format.
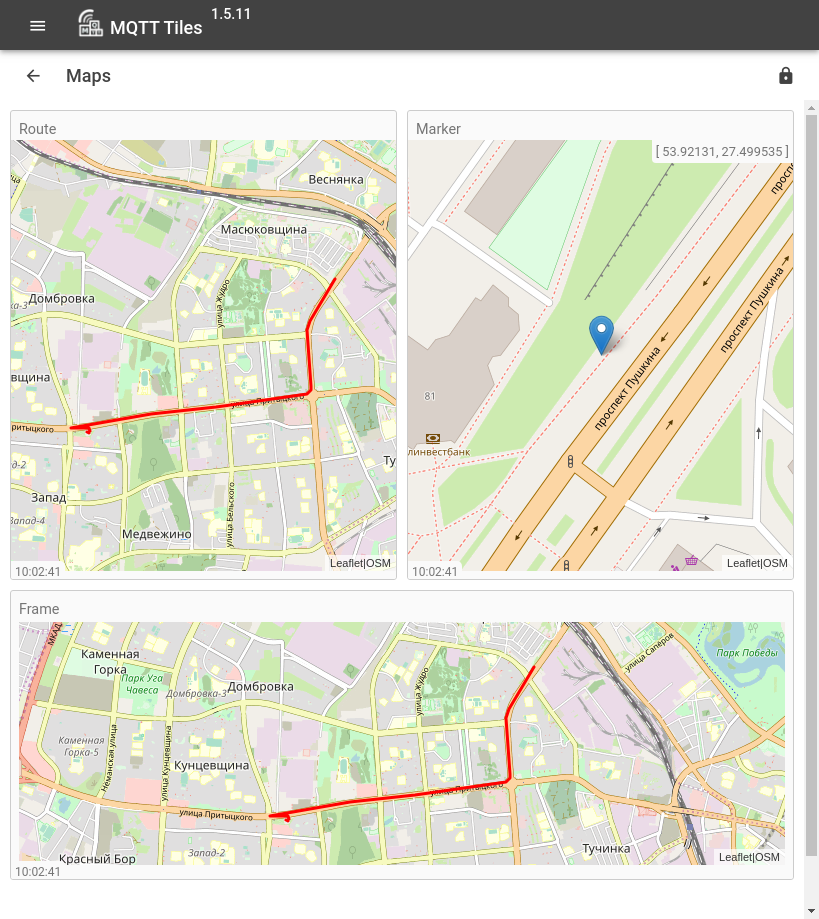
We frequently face the need to show certain data on the map. For instance, right now MapView is used to render Map (Location) and Map (Route) widgets in MQTT Tiles as well as an example in the iframe widget:
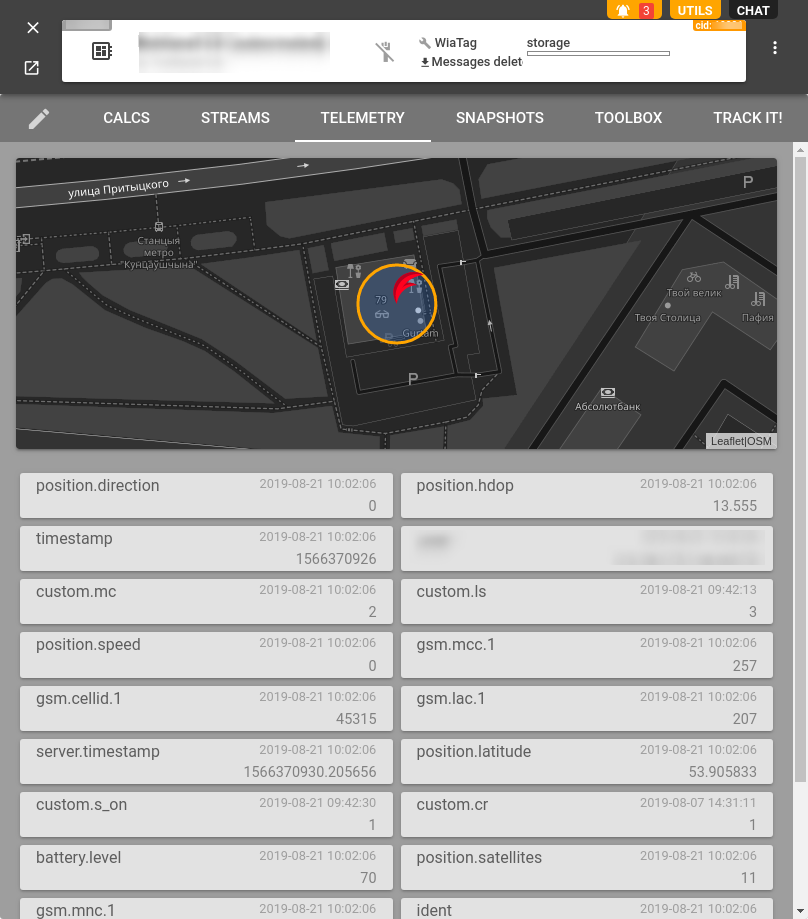
You can also meet MapView in the flespi.io panel in the device telemetry tab:
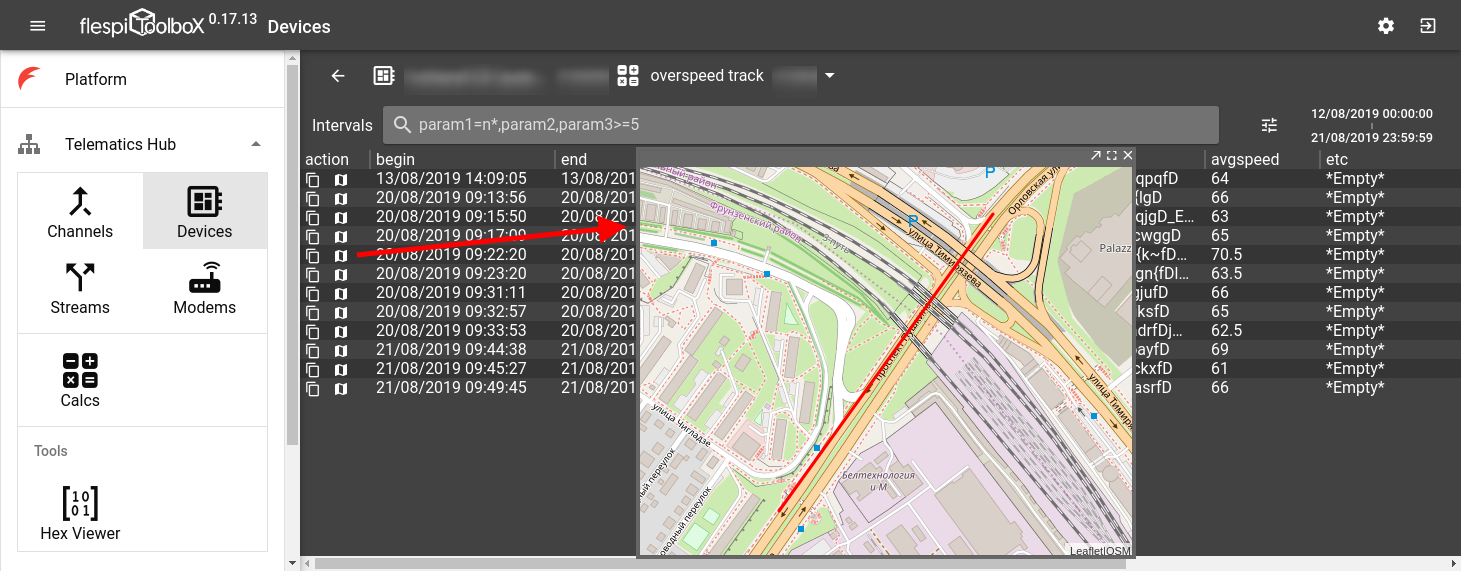
If you add the route counter type in the calculator, you’ll be able to see the calculated intervals on the map directly from Toolbox:
Starting with MapView
The concept of MapView (as well as of FormBox) is a no-brainer. MapView embeds into the webpage using an iframe and visualizes the data transmitted in the same PostMessage from the parent page:
<iframe id="map" src="https://flespi.io/mapview/"></iframe>
The parent page should subscribe to the MapView messages as follows:
    window.addEventListener('message', function (event) {
      if (typeof event.data === 'string' && event.data.indexOf('MapView|') === 0) {
        console.log(event.data)
        ...
      }
    })
Once fully loaded MapView will acknowledge its readiness to work and receive commands:
MapView|state:{"ready": true}MapView automatically zooms the map in or out to fit all elements on the screen.
Now you are all set to send commands. The command format looks like this:
document.getElementById('map').contentWindow.postMessage('MapView|cmd:...', '*')MapView commands
Below are the examples of commands that will draw respective elements on the map.
Marker
MapView|cmd:{"addmarkers": [[53.9017366,27.4572254]]}Point marker
MapView|cmd:{"adddots": [[53.9293366,27.452825400000002]]}Circular geofence
MapView|cmd:{"addcircles": [{"center": [53.9248366,27.4626254], "radius": 100}]}Polygone
MapView|cmd:{"addpolygons": [[[53.90557,27.45642],[53.90951,27.45633],[53.91391,27.45968],[53.91695,27.46904],[53.91573,27.47599],[53.91422,27.46784],[53.91179,27.46285],[53.91235,27.46751],[53.91170,27.47155],[53.90973,27.46262]]]}Active track (will update when new points are added)
MapView|cmd:{"appendpoints": [[53.916836599999996,27.4607254],[53.926636599999995,27.4597254],[53.92573659999999,27.4577254],[53.9258366,27.452525400000003]]}Append the active track with Google Polyline track
MapView|cmd:{"appendgroutes": ["yl_hIsqqfDsWPoZ}S_Roy@rFmj@lH|q@dNd^oBc\\`CgXhKxv@tWf`@"]}Add separate Google Polyline track
MapView|cmd:{"addgroutes": ["ik_hIkvqfDmExDcEqP~EuDgCwNfEsEjE`TyEzDbCtJ"]}Enable zoom controls
MapView|cmd:{"zoomcontrol":true}Debug mode on
MapView|cmd:{"debug":true}Clear all
MapView|cmd:{"clear": "all"}Clear specific elements
MapView|cmd:{"clear": ["polygons", "circles", "dots", "markers", "polylines", "track"]}Trying MapView
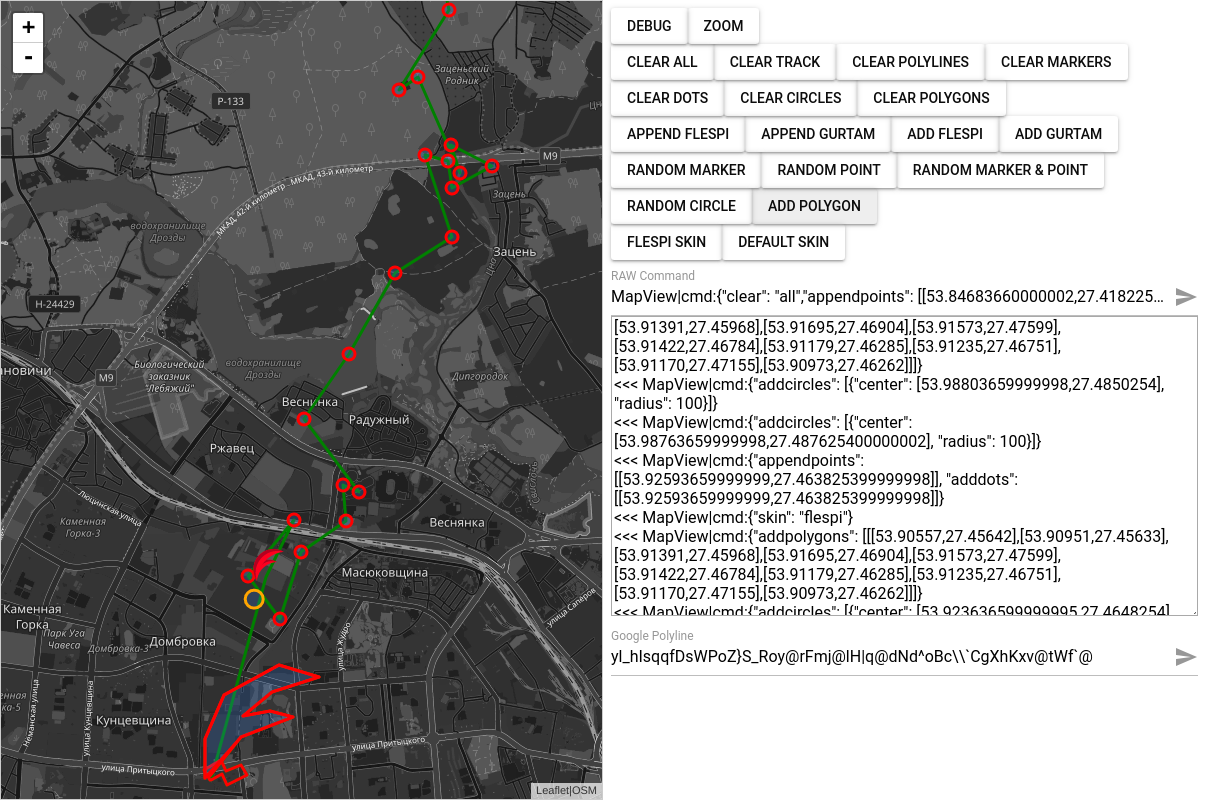
MapView also features a sandbox to play around with the map and get the feel of what it can accomplish: https://flespi.io/mapview/#/example.
***
Next time you need to put something on the map and plug it into your project, remember of MapView.
If you have any ideas, comments or emotions with regards to the MapView project, share or discuss them in a dedicated forum thread: