Many flespi integrations are accomplished using MQTT API. But each integration is unique: different systems, technologies, architecture solutions, and MQTT libraries may lead to various MQTT connection problems. This article describes how to analyze raw MQTT session traffic which may help you diagnose such problems as:
failure to establish the connection
unexpected disconnect
missing subscription messages
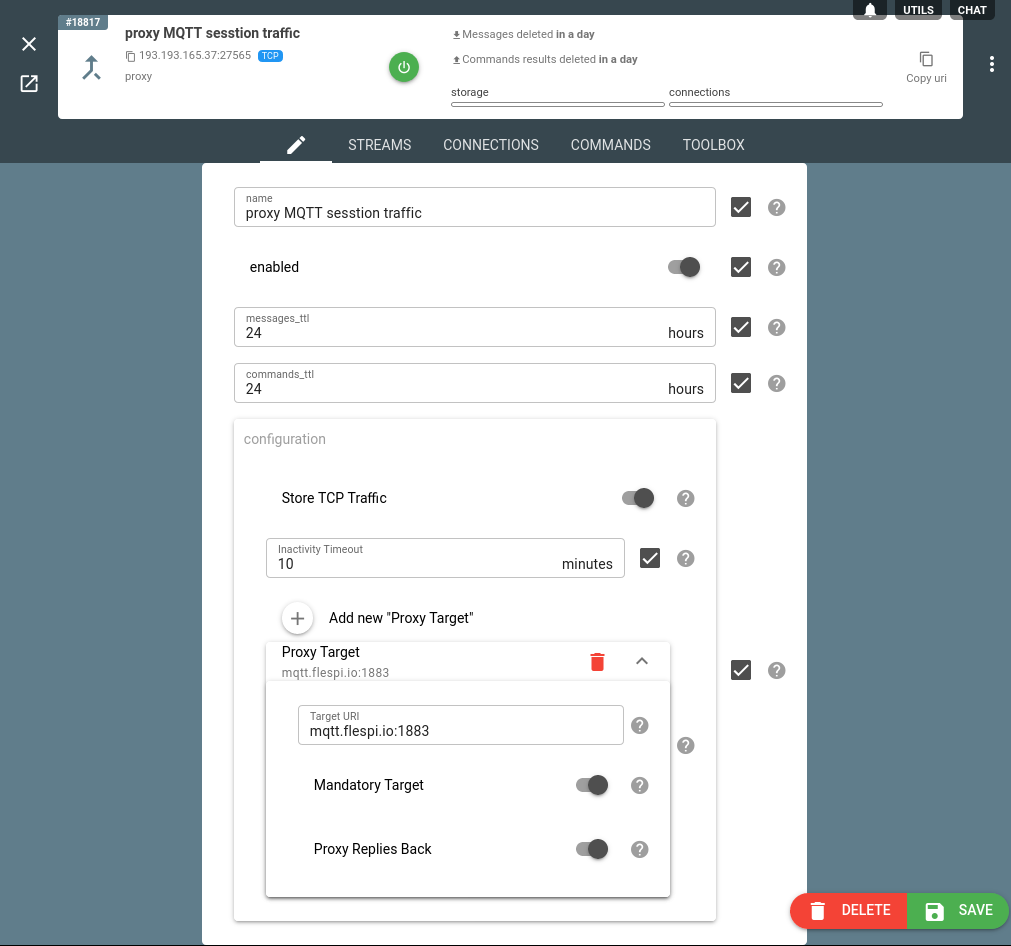
1.Create a channel
Create a proxy channel, specify mqtt.flespi.io:1883 as target URI, make this target Mandatory, and enable Proxy replies back to the client.
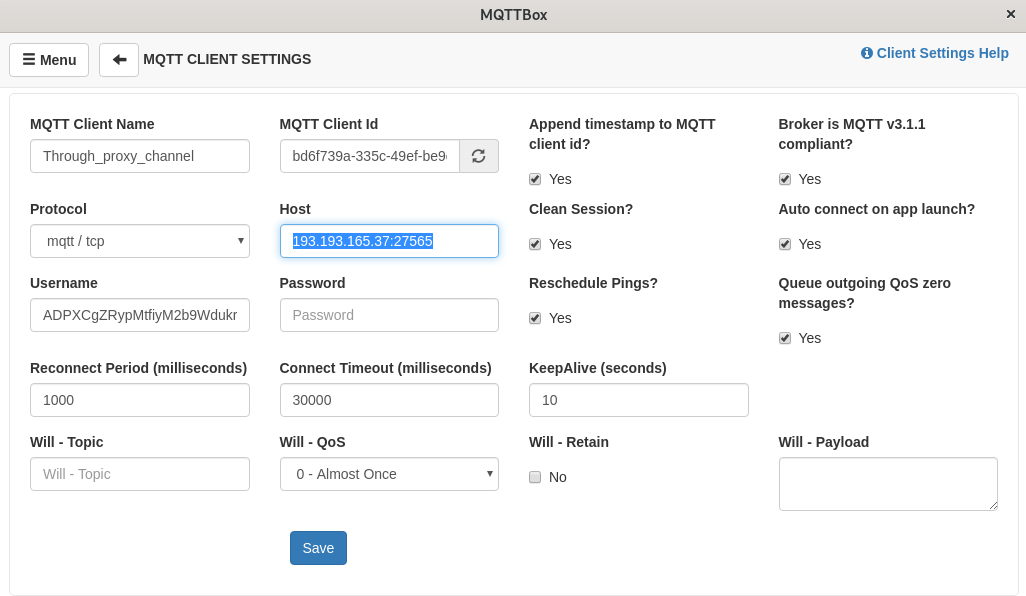
2.Configure MQTT connection
You should use your channel URI to connect the MQTT client to the broker. If you use an SSL connection to port 8883, you can hardly see the message details, so we recommend using the unencrypted session for debug purposes.
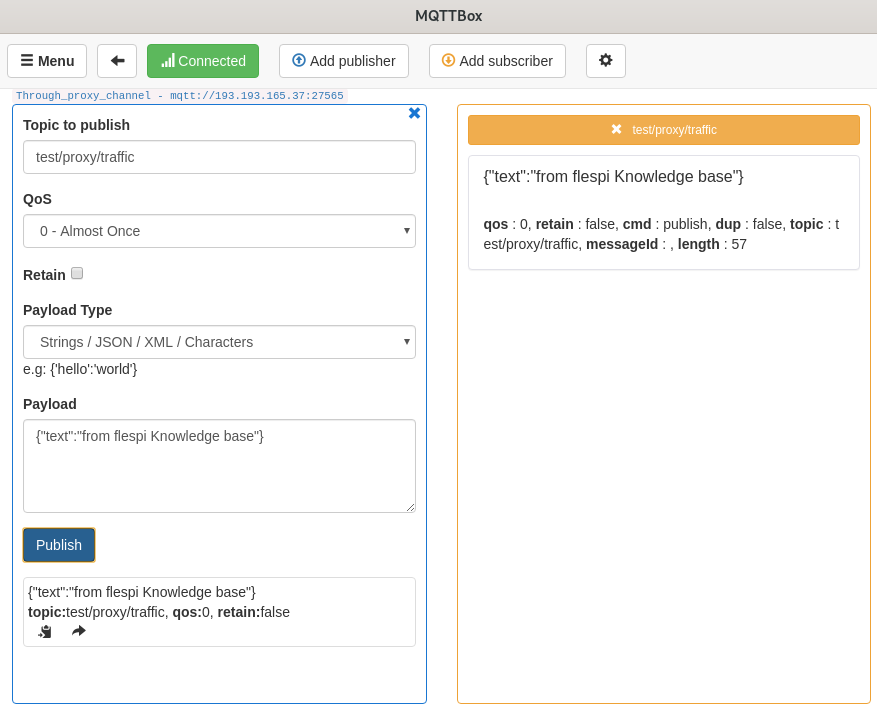
3.Test MQTT connection
Subscribe your client for some topic with MQTT API data, do some manual publishing or just try to reproduce the error-causing situation.
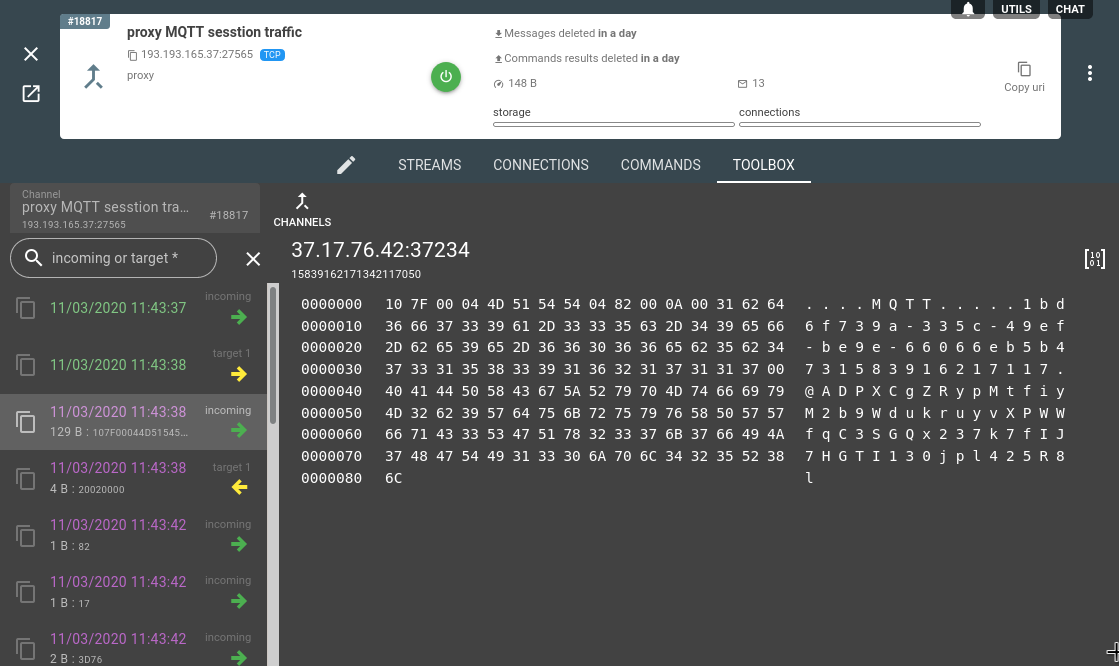
4.Explore raw MQTT traffic
Use HEX viewer to analyze what’s inside the MQTT connection. E.g. this is the CONNECT packet
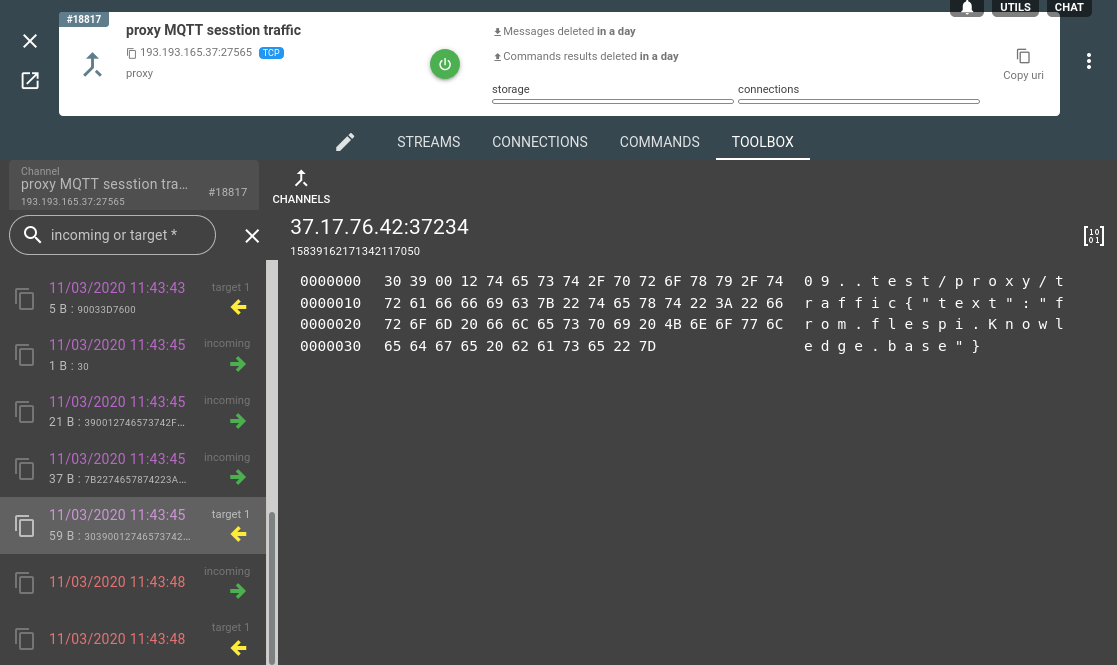
This is an example of a published packet:
If you need to analyze the raw data that comes inside the connection, you should refer to the MQTT specification of the appropriate protocol version you use in your application.