Recently we have introduced the proxy protocol into the flespi platform to allow forking of the incoming raw telemetry data stream to several destinations. Another application of the proxy channel is debugging connectivity issues. Since proxy transmits raw data, investigating data packets implies extensive exposure to endless HEX sequences.
Being heavily involved in packet sniffing, we were highly interested in a tool that would facilitate the process as much as possible. So, meet the HEX Viewer as a part of the flespi Toolbox — colorful, flexible, and practical.
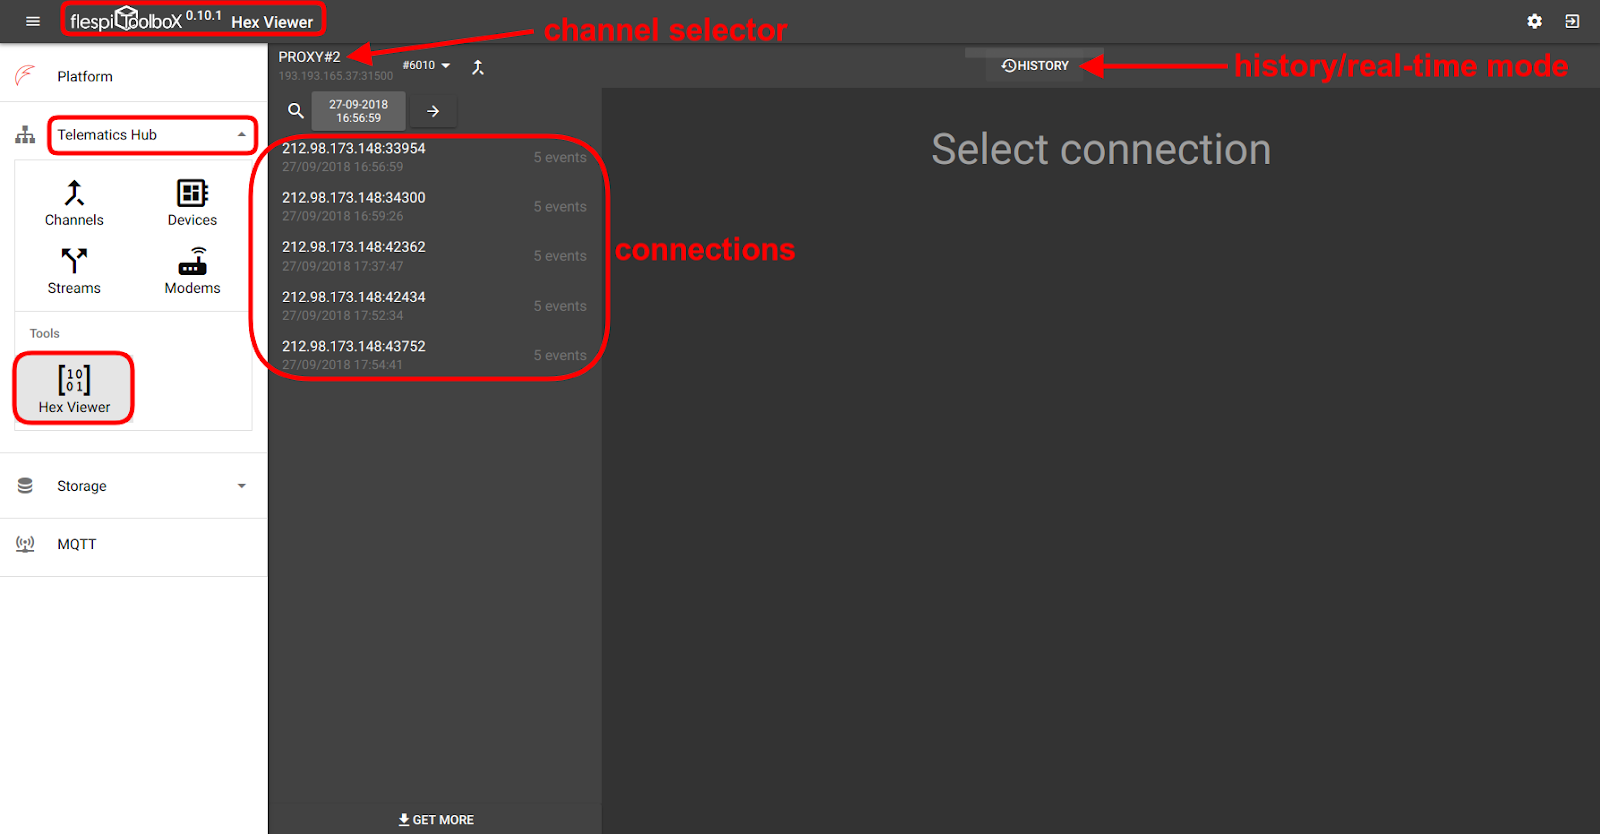
To start working with the HEX viewer login with https://toolbox.flespi.io/ (or find the Toolbox link in the left-side menu of the flespi panel), unfold the Telematics hub item and select HEX Viewer.
Then you drill down the sequence — channel -> connection -> event.
Select a channel
Note that HEX Viewer works only with proxy channels carrying raw data. Select the one you want to look into from the drop-down on top.
Hint: to view raw traffic for any other channels, use the Traffic Viewer tool.Then you can switch between the history and real-time modes depending on the task.
If in history mode, you have a date/time picker to quickly move to the desired moment.
Select a connection
With the channel picked, you see a list of connections for the chosen time (or the current moment).
Click on the connection to view the details.
Select an event
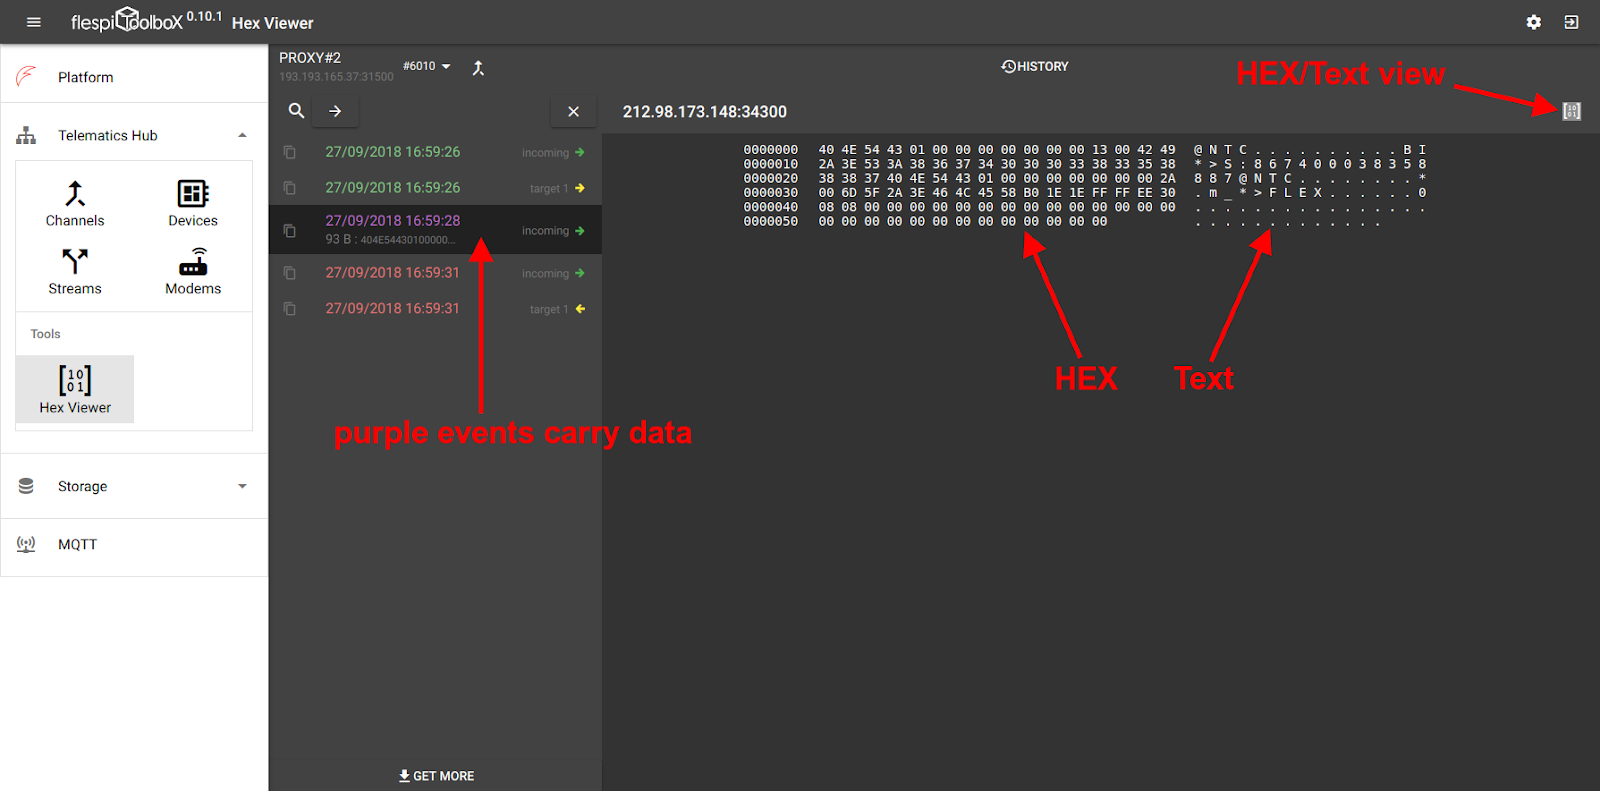
When you click on the connection you see the list of all events in it. There are three types of events:
Green — connect
Purple — data
Red — disconnect
HEX Viewer only makes sense for the purple events that contain the actual payload. The only information that you can see for connect/disconnect events is the time they occurred.
Note: select several events with the Ctrl key pressed to see the payload of several packets on the same screen.
Search
A magnifying glass above the connections and events list allows searching in the given list. For connections, you can search by IP and port. For events, you can search by connection type (incoming or target).
Export data
There’s often the need to copy the data you are investigating into another application, in an email, etc.
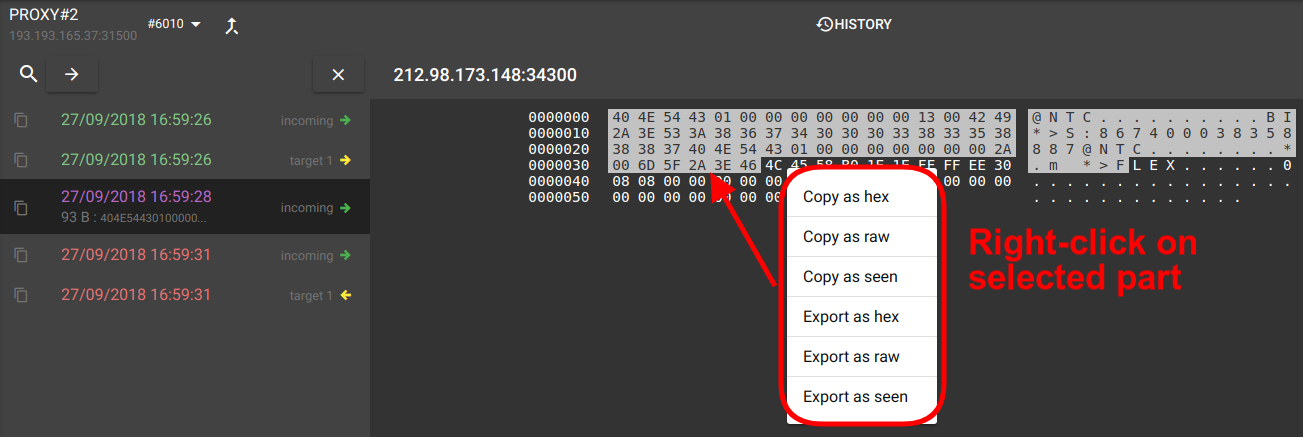
Select the block of data you want to copy/save and right-click on it — you’ll get a selection of quite a few options:
Copy options will save the block to clipboard
Export options will open the Save as… dialog
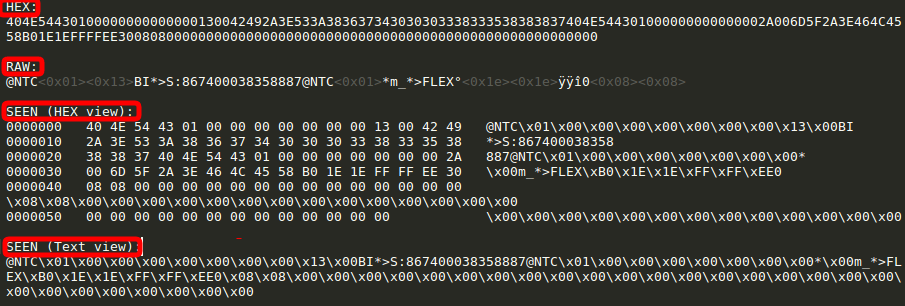
Here’s how the same message will look in hex, raw, and seen representations:
***
Yes, it is still a hex viewer with the sole purpose of making the perception of the hexadecimal values friendlier. We simply tried to make it more ergonomic. Give it a try and let us know about your experience.


