flespi toolbox is an all-round diagnostic environment for handy debugging and analysis of any activity within the flespi platform. This guide provides practical knowledge that you can start applying to the telematics side of your business straight away.
The most up-to-date overview of all Toolbox features is available in the dedicated KB guide.
To get access to a wealth of information about every item in your infrastructure — channels, devices, streams, modems, containers, CDNs, MQTT connections do the following:
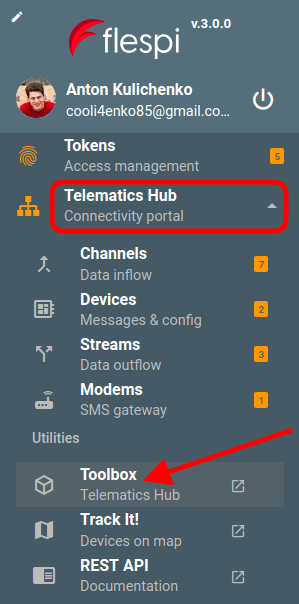
(i) Pick the Toolbox inside Telematics hub, Storage, or MQTT menu:
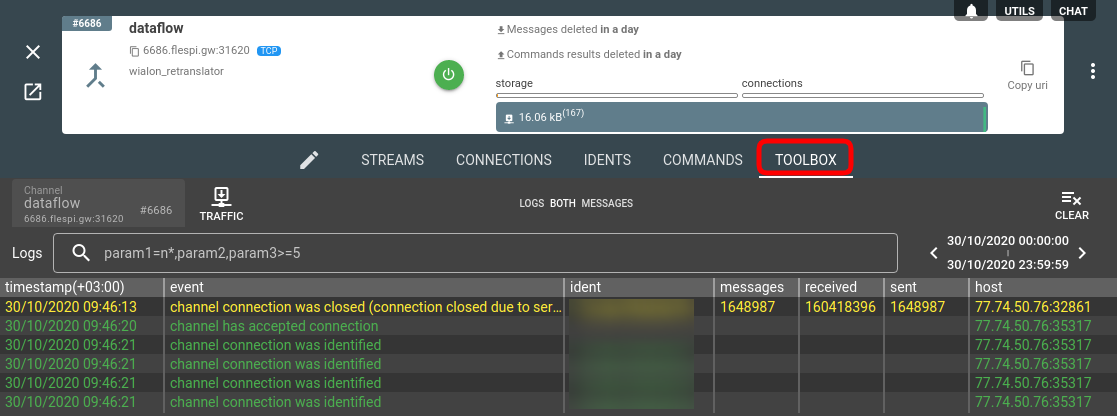
or (ii) navigate to the Toolbox tab on the item's card:
or (iii) open Toolbox separately at the link https://toolbox.flespi.io/:
Note that when opened as a standalone application, Toolbox offers convenient filtering within one element type (e.g. channels). You can filter channels, devices, and streams by name or id, and additionally can filter devices by ident (IMEI).
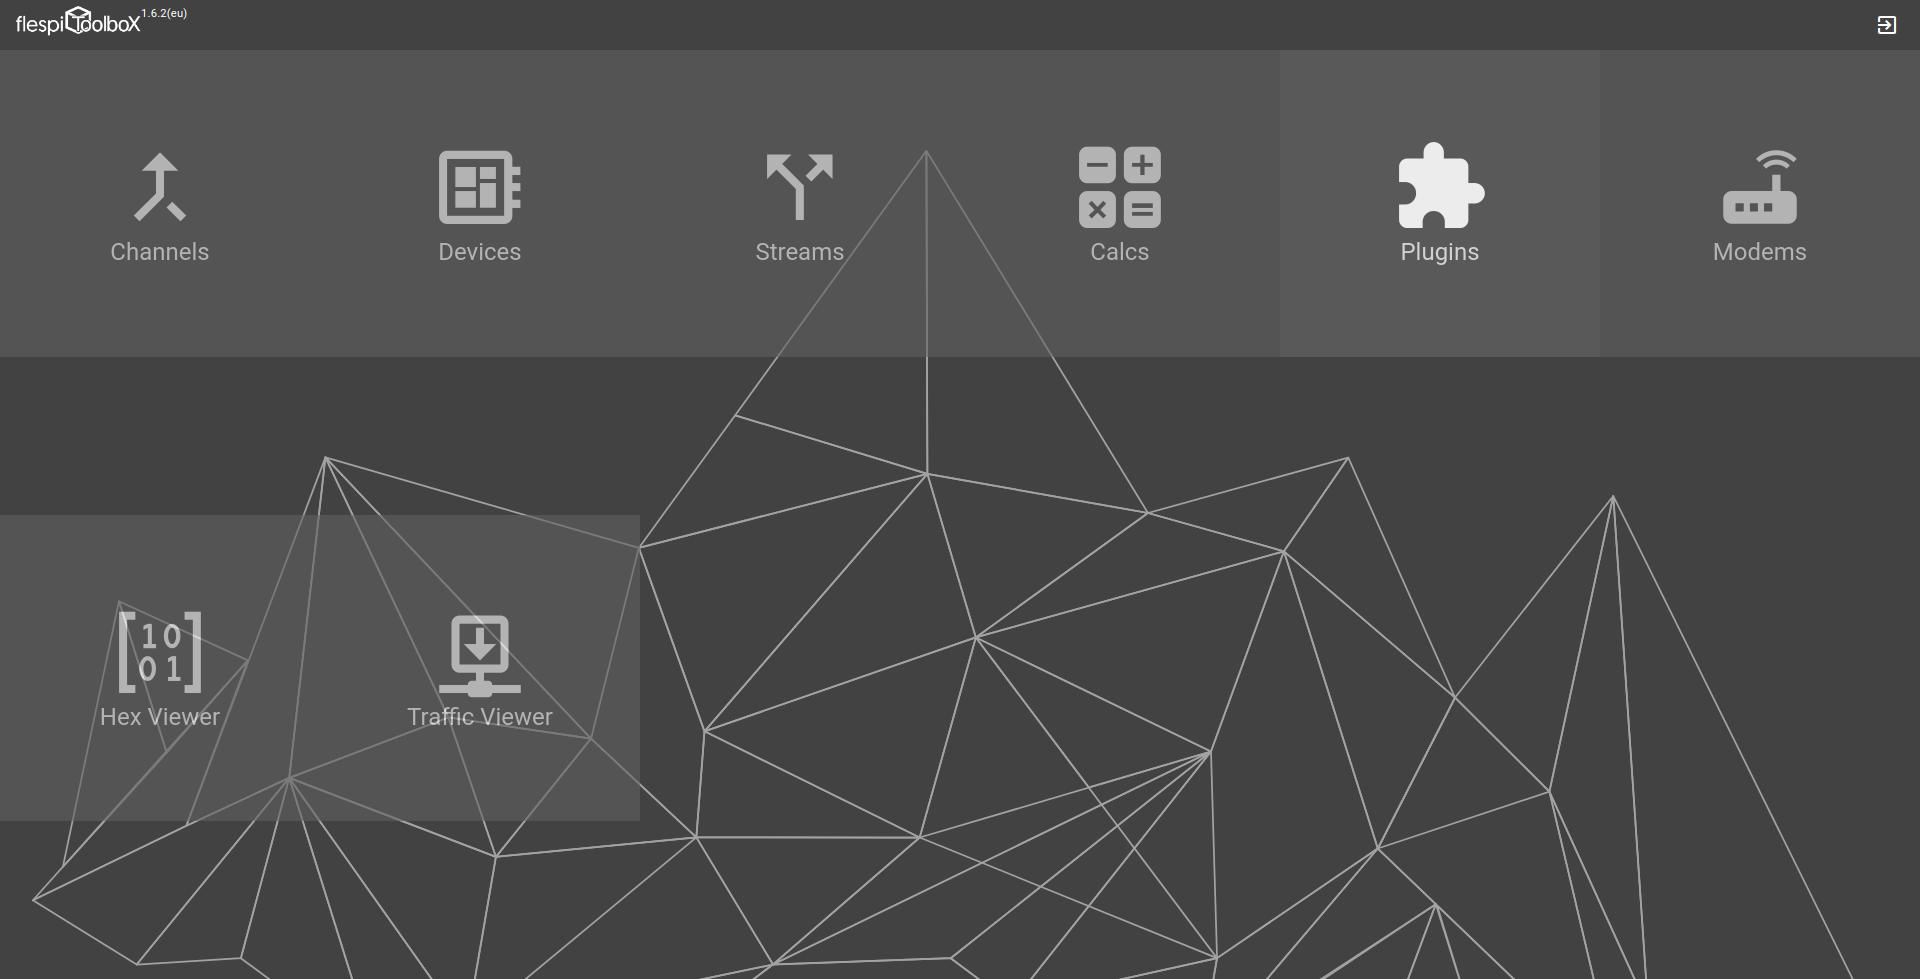
Main screen
The screen below shows the Channel logs and messages; it will look the same for Devices and Modems (logs on top and messages at the bottom). The Streams only have the logs pane since they only forward messages but do not store them.
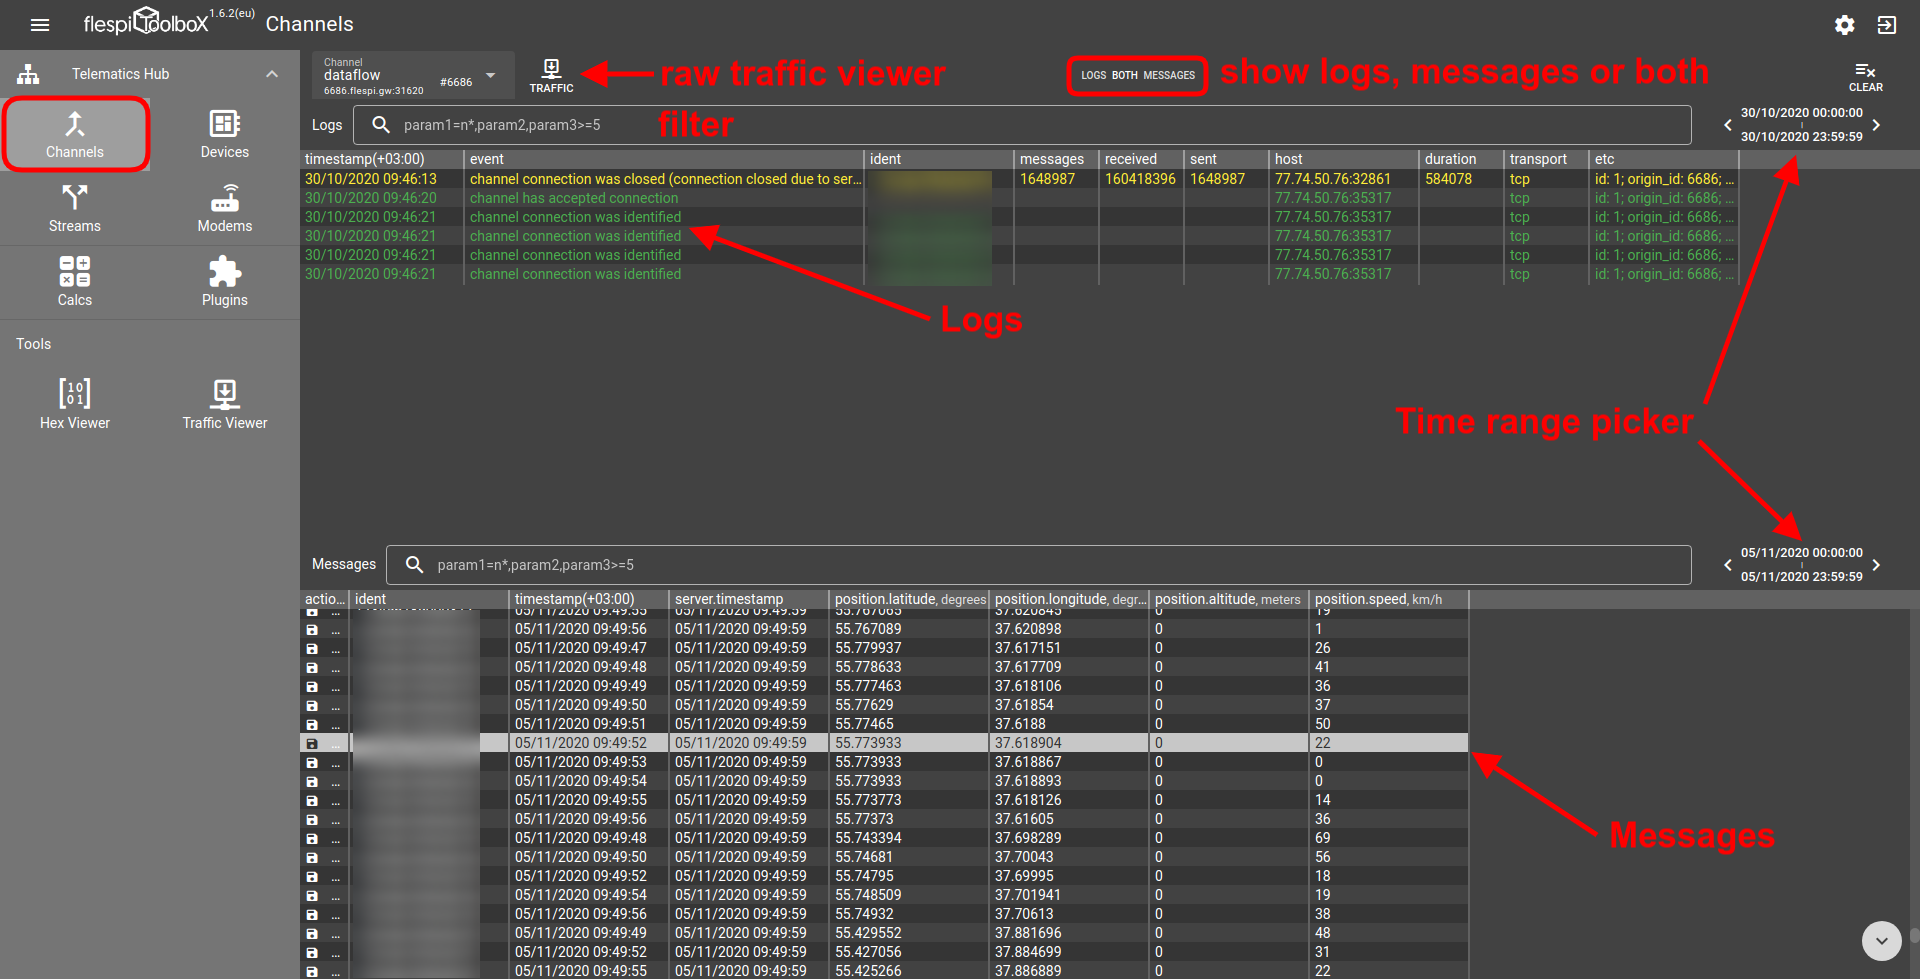
The channel (or another item) selector is right under the logo. To the right of it sits the button switching between historical and real-time logs. Note, that real-time mode also shows a few recent historical messages above the red line.
Now let’s see when the flespi Toolbox comes in handy, what specific functionality stands behind it, and how your journey through thousands of records can still be effective.
Logs tell stories
Pretty much every action with the item (channel, device, etc.) is logged. This means that you can view at which step the problem occurred, the type of problem, when it took place, and more.
For example, you can check the specific error codes within a certain period. Or, if someone made an unauthorized change to your channel settings, you can see when it happened and which specific parameters were affected.
If you want to add columns for specific parameters, right-click on the table header in the Messages pane and select the Add column item:
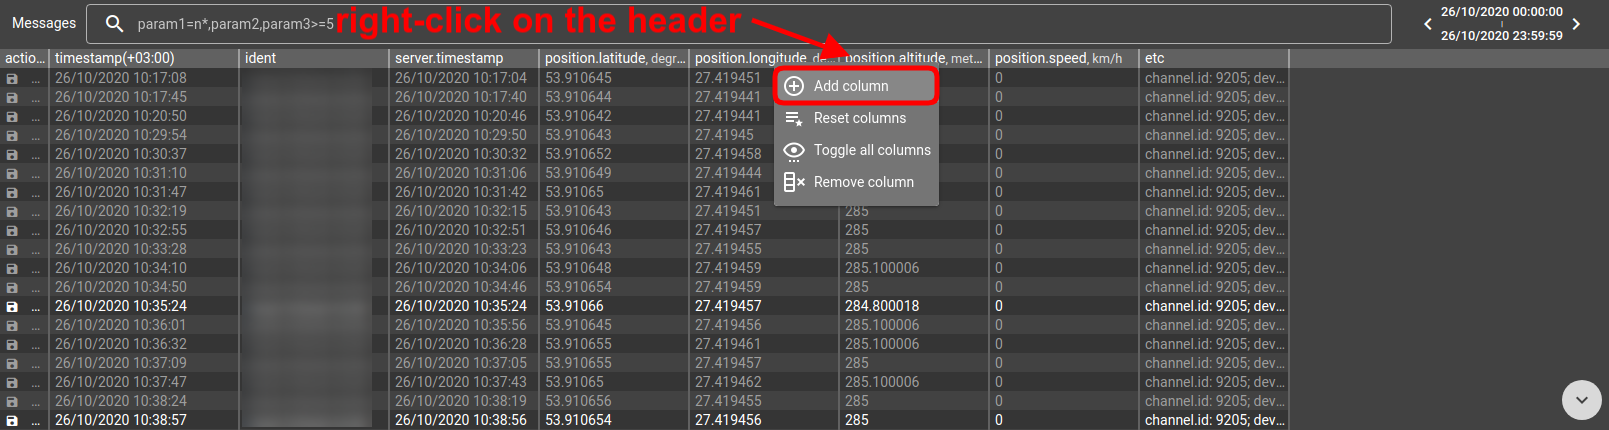
Select Toggle all columns to add columns for all parameters in the message.
To hide the column, right-click on the column and select the Remove column item.
To revert the list of columns to defaults, select the Reset columns item.
To change the order of columns in the table simply click and hold the column on the header and drag it to the desired position.
Messages carry value
Messages are the core of telematics communication — they are the raw material for any decisions and insights. You don’t need to make a REST API request to view messages, Toolbox presents detailed message information in chronological order and allows easy flicking through hundreds of lines (just click an arrow button ->). Message viewer is particularly helpful for debugging but you can come up with countless uses depending on your tasks and issues.
For instance, you set up a tracker to send messages every 20 seconds, but suspect that fewer are coming. You can filter messages by ident of the target tracker and look through the timestamps to see if messages arrive as frequently as expected.
If you want to see all message parameters, click anywhere on the message line. You can also add custom columns to the messages table (see how we did it for the logs above).
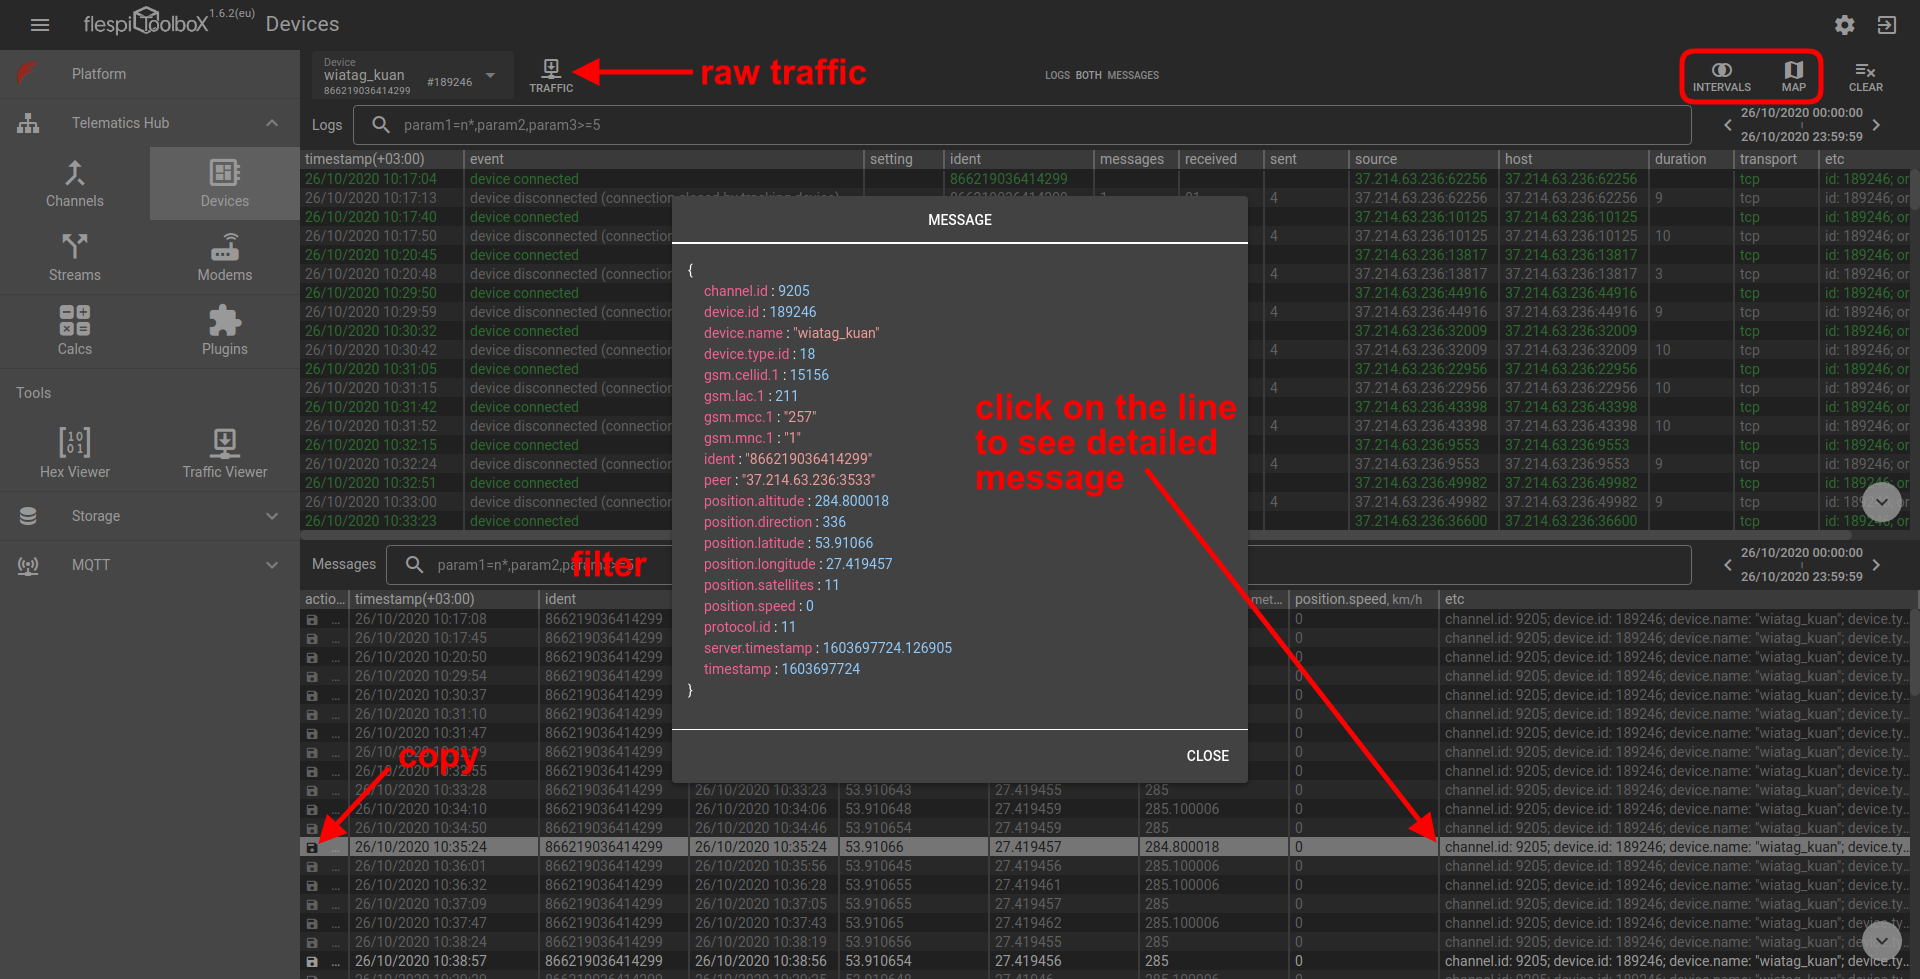
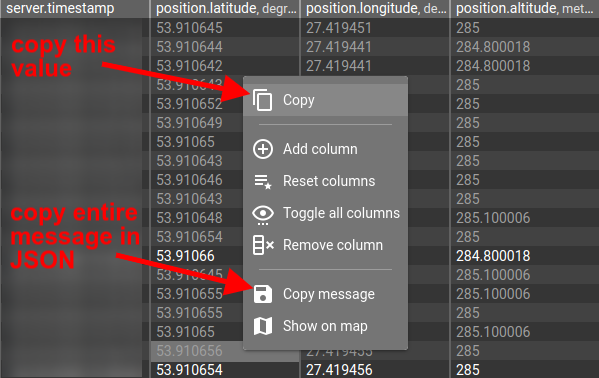
Right-clicking on a table cell opens the context menu with some helpful options:
- Copy option will copy the specific value on which the right-click was made
- Copy message will copy the entire message with all parameters as the JSON object
- Show on map allows quickly seeing the dot on the map with the latitude/longitude taken from the selected line
Filters simplify search
Both logs and messages panes feature an identical filter control for quicker navigation through the records. Hover over the column title to see the parameter name to use in the filter.
Here are the supported filtering expressions:
- logical comparisons (>,>=,<,<=,=) with numeric values — e.g. “duration>20”:

- finds a given substring in a string parameter value — e.g. “ident=='*est*'”:

Wildcard (*) at the beginning of the substring instructs to look for inclusion anywhere in the parameter value (not only from the first position). The "*" at the end tells the filter to perform text value search (not numeric one). - several conditions separated by "&&" are interpreted as an AND statement (all conditions should be met), e.g. “ident=='*pass*' && duration>40”:

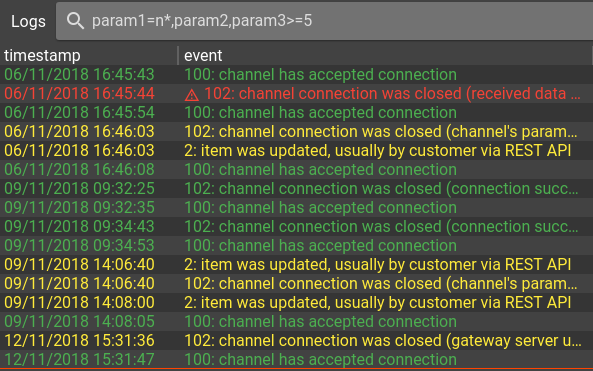
Colors focus attention
The color scheme used for the log records intends to drag your attention to events in order of importance: red ones require immediate attention (errors, failures); yellow ones usually refer to updates, changes, sending messages; green ones report successes, and grey ones signify correct termination or closing.
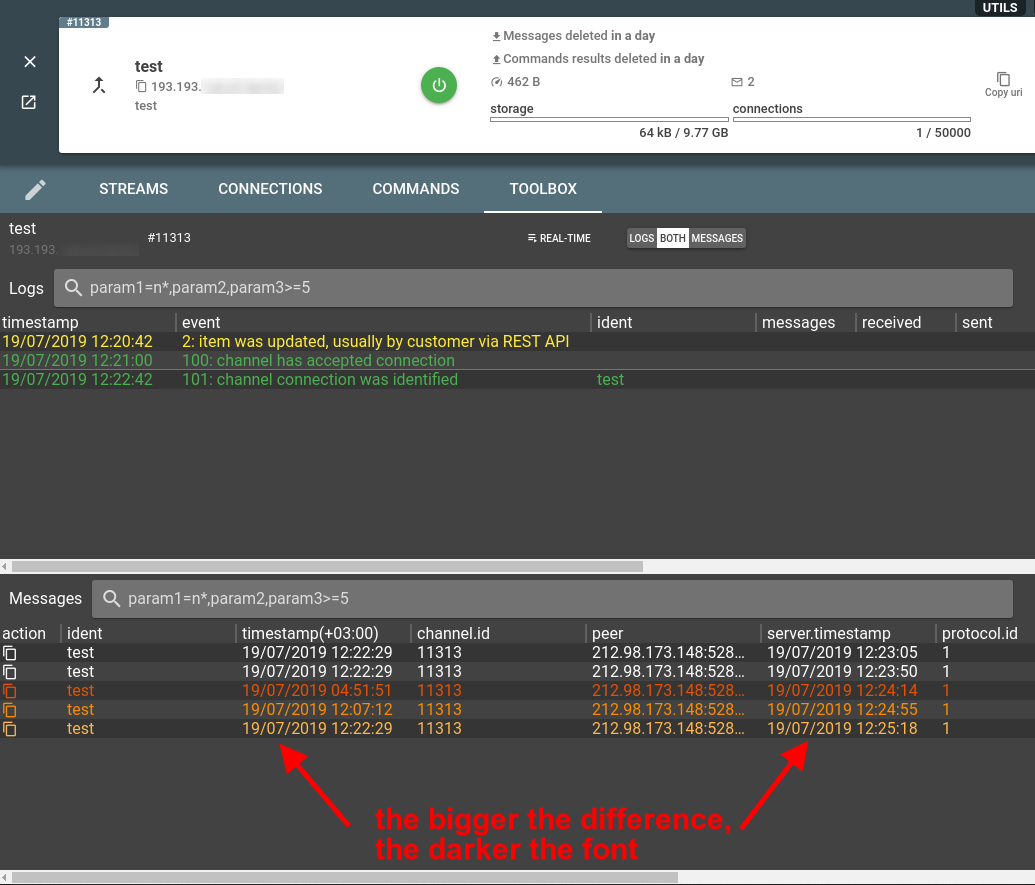
Toolbox also color-codes device messages depending on their "freshness" — the further the message arrival time from the current time, the darker it will show in the list:
Settings customize experience
The ways you will use the Toolbox are plenty and diverse that is why we tried to make it flexible.
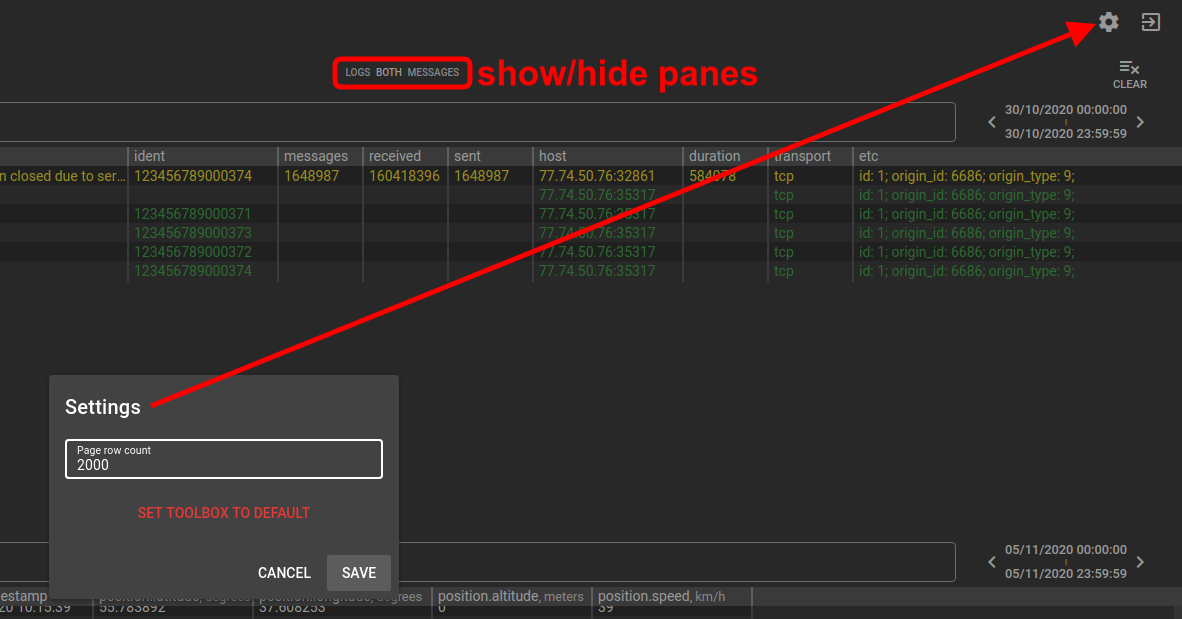
Gear button on the top right opens global settings which allow specifying the number of lines shown in each of the two tables on the main screen (1000 by default; reduce on slow browsers).
Use the Logs-Both-Messages switch on top to customize which panes to show.
***
We are trying to transform the routine log crawling job into a productive pastime. Tell us what features can improve your experience, and we’ll gladly consider them.
And surely try the joint power of the flespi panel and the flespi Toolbox.
P.S. To stay in sync with the latest changes, subscribe to the Toolbox changelog on our forum.