Overview
Toolbox is a comprehensive instrument giving a complete understanding of what has happened to the flespi platform in each specific moment. It offers all available records (logs and messages) about all functional elements in your flespi account.
The entities are grouped into the following logical sections:
Platform — includes log records about accessing the platform.
Telematics hub — the core section that includes information about all key elements of the flespi platform — channels, devices, streams, calculators, plugins, modems.
Storage — includes logs about the storage elements — containers and CDNs.
MQTT — includes logs about all MQTT sessions created and closed within your account.
Accessing Toolbox
You can access Toolbox in several ways whichever is more convenient:
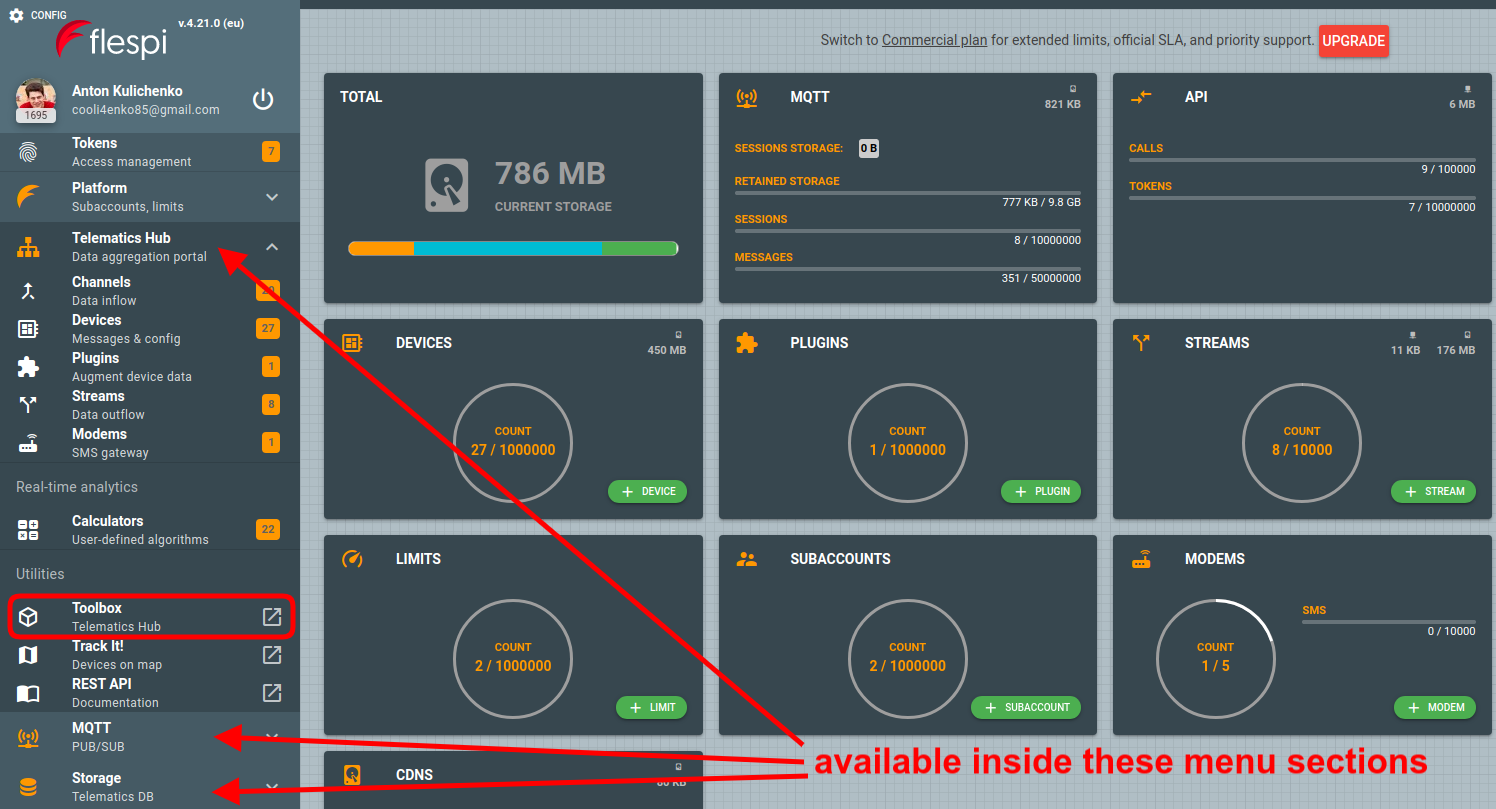
(i) Find the Toolbox item inside the Telematics hub, Storage, or MQTT menu section to open the respective Toolbox view:
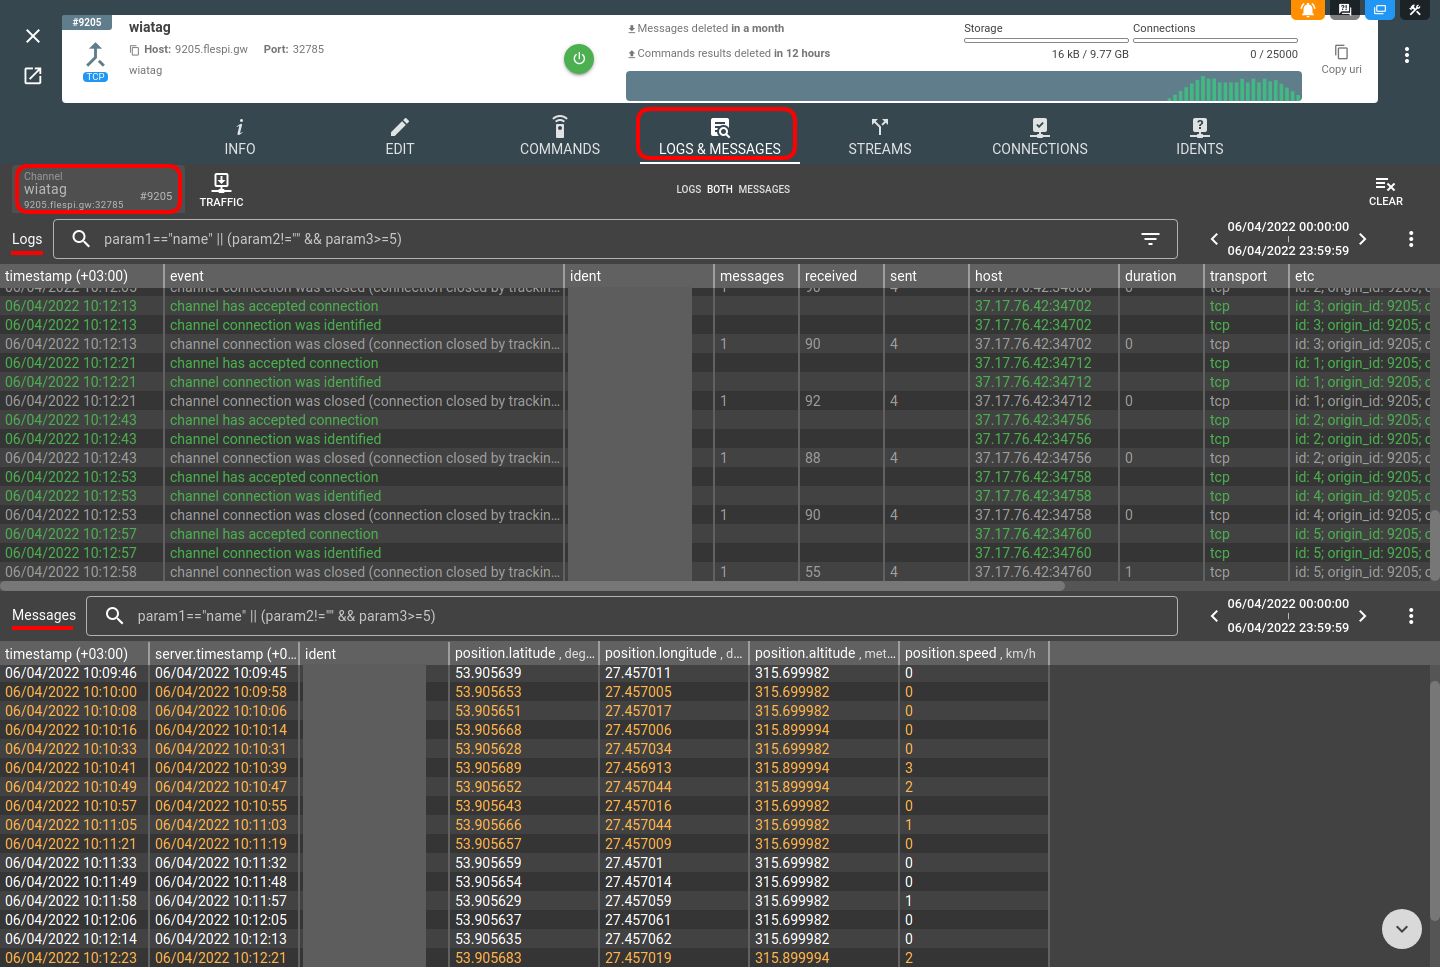
or (ii) navigate to the Logs & Messages tab on the item's card (available for all item types):
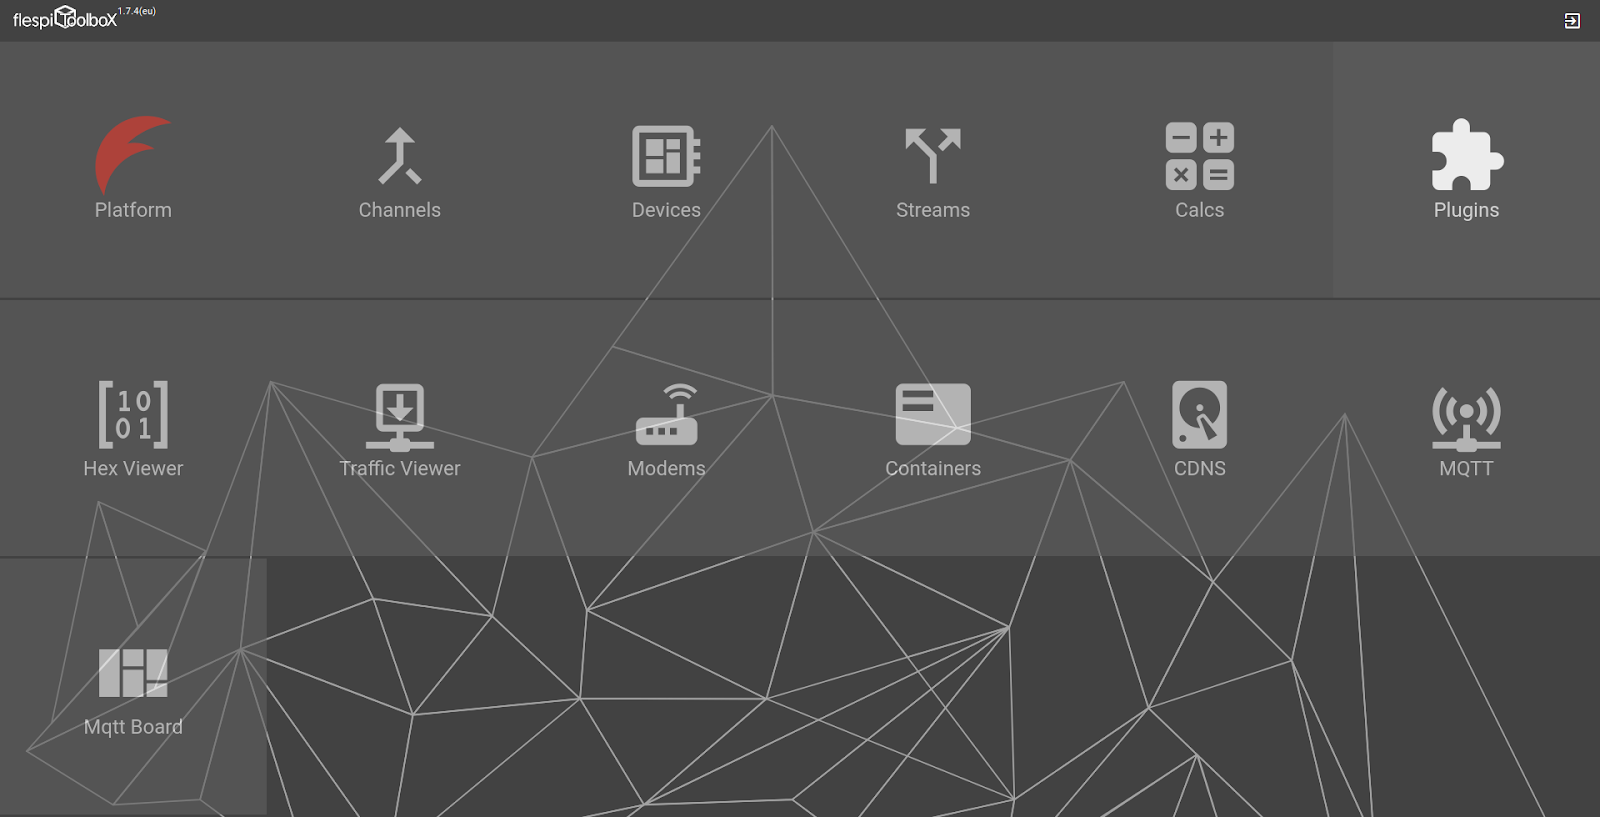
or (iii) open Toolbox separately at https://toolbox.flespi.io/:
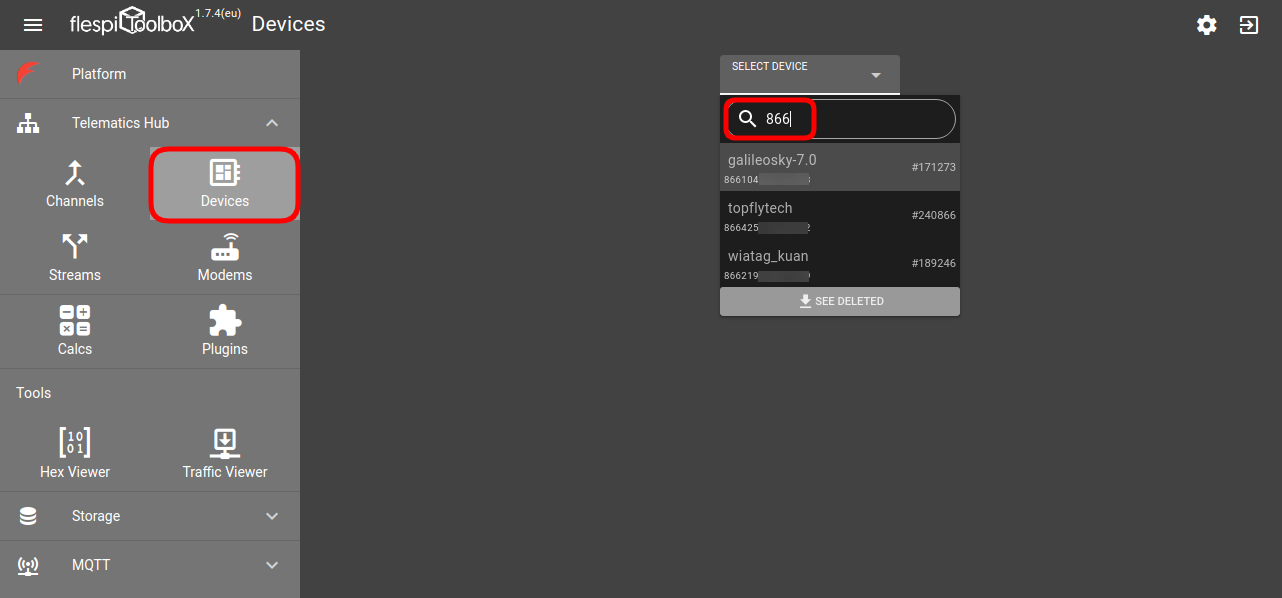
Note that when opened as a standalone application, Toolbox offers convenient filtering within one element type (e.g. channels, devices, etc.). You can filter all item types by name or id, and additionally can filter devices by ident (IMEI).
Access by token
If you want to give a 3rd party (e.g. a hardware manufacturer, co-worker, etc.) access to a certain device (or a list of devices), you can generate an ACL token for them with the following permissions:
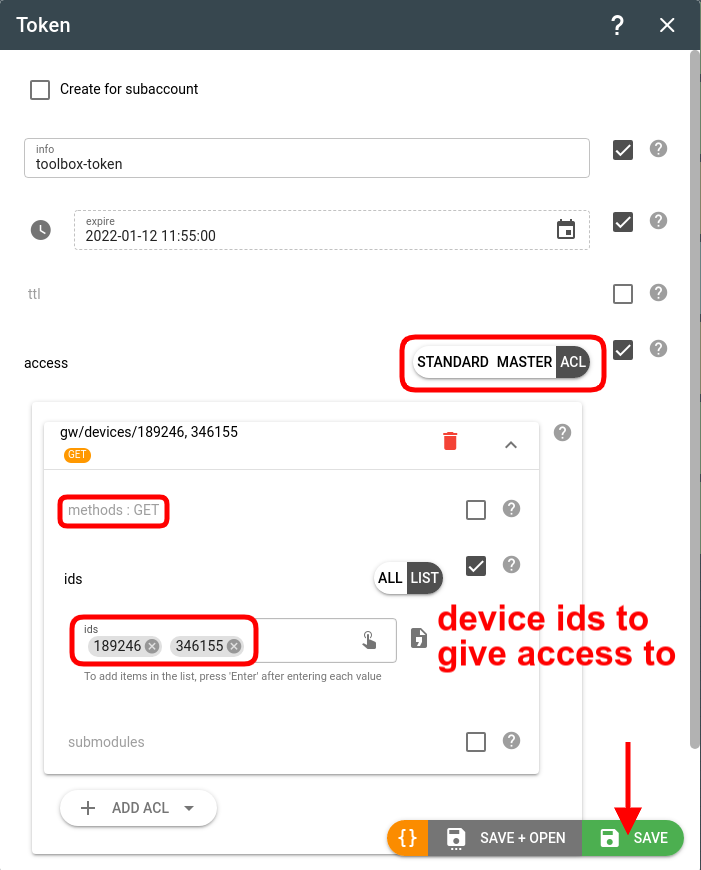
Then you can give the link of the following format to the 3rd party:
https://flespi.io/toolbox/#/login/{Token-with-ACL-to-specific-devices}
Main screen
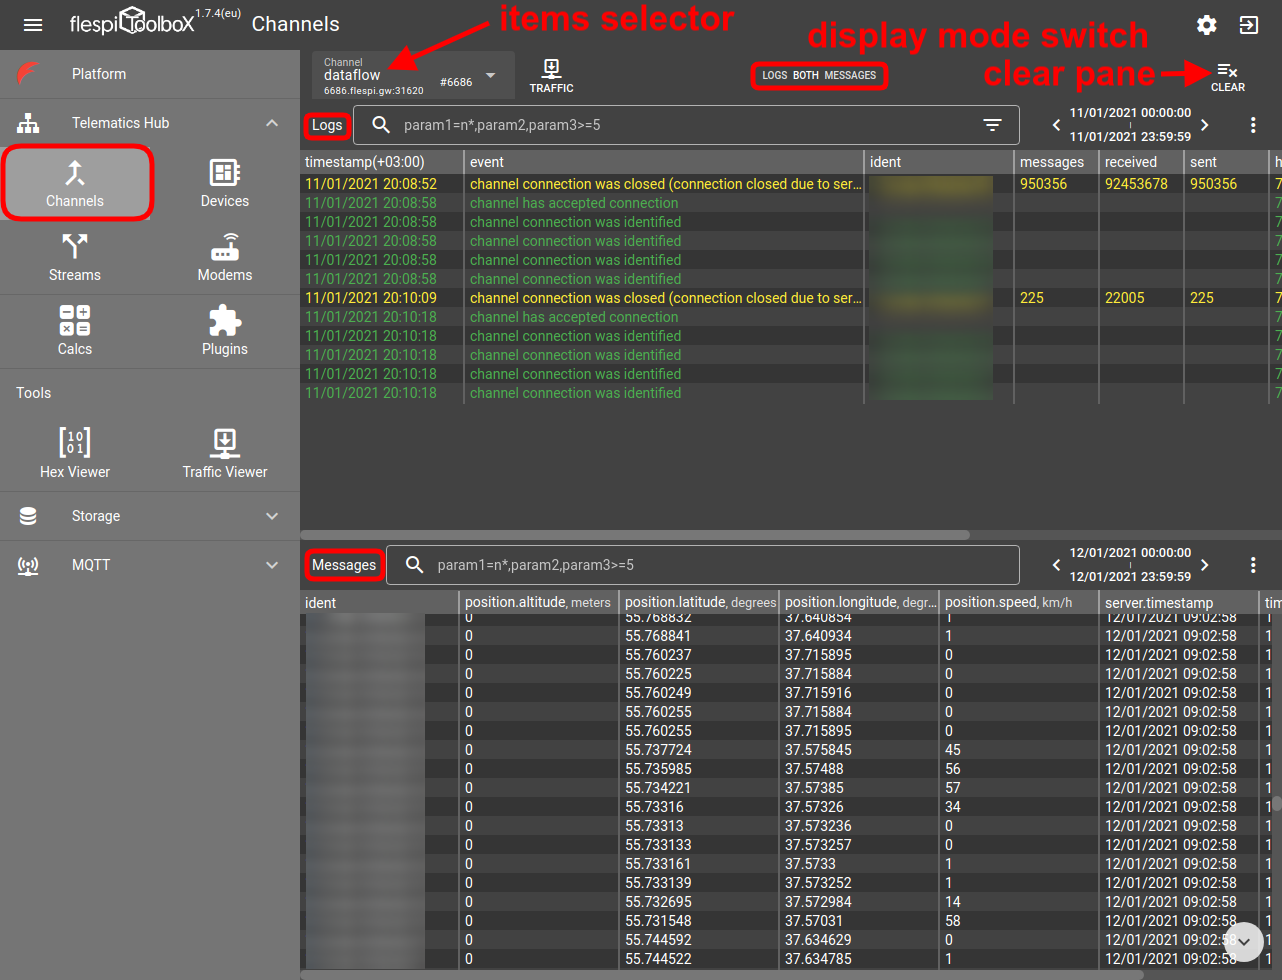
When you open Toolbox for a particular item it will show either logs and messages panes (for channels and devices) or only logs page (for platform, streams, modems, calcs, plugins).
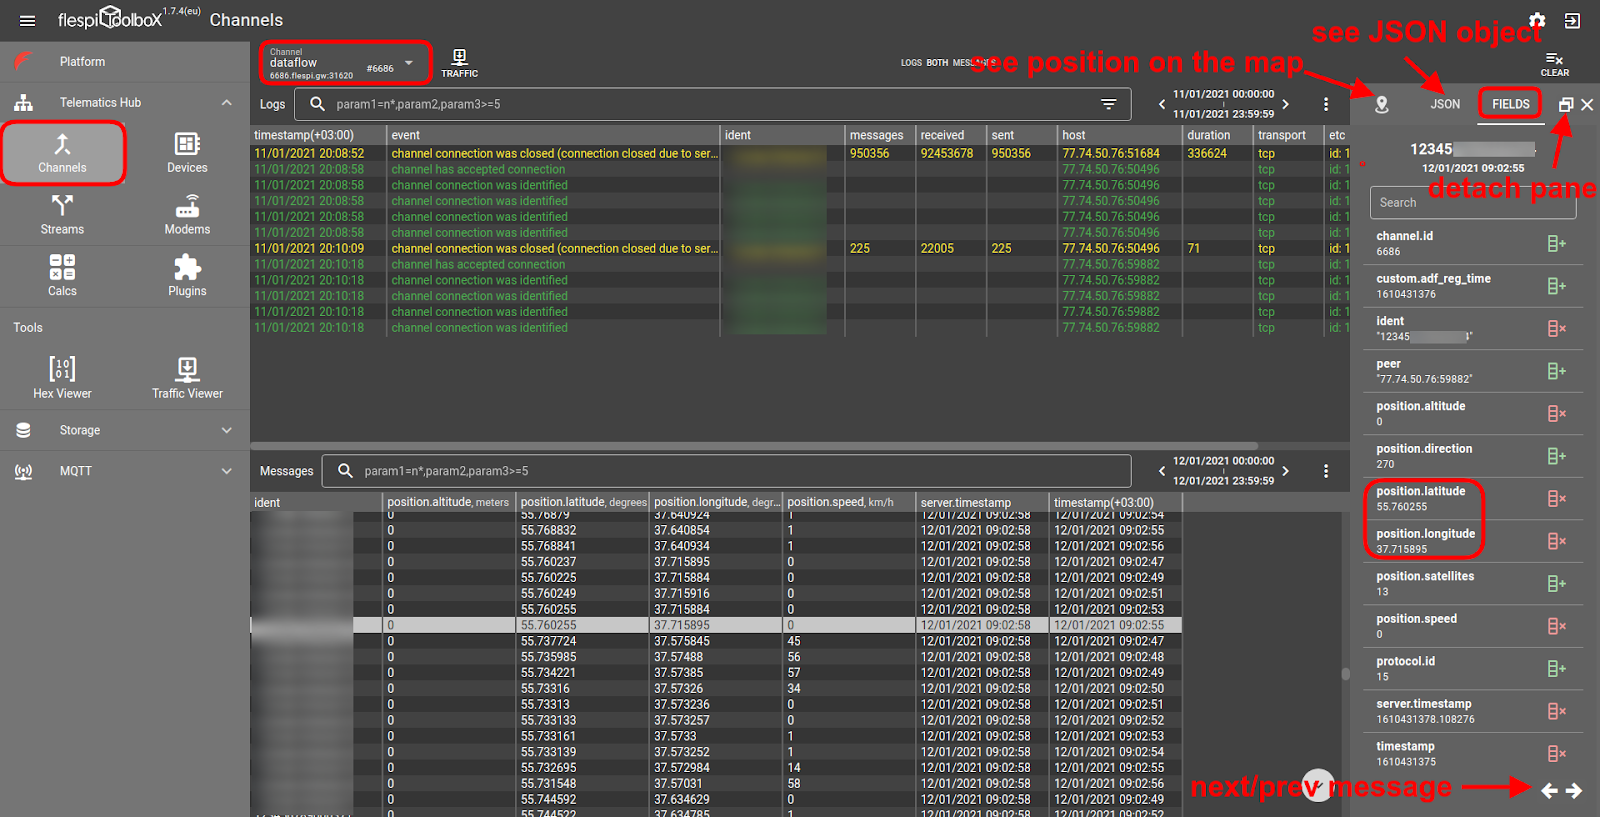
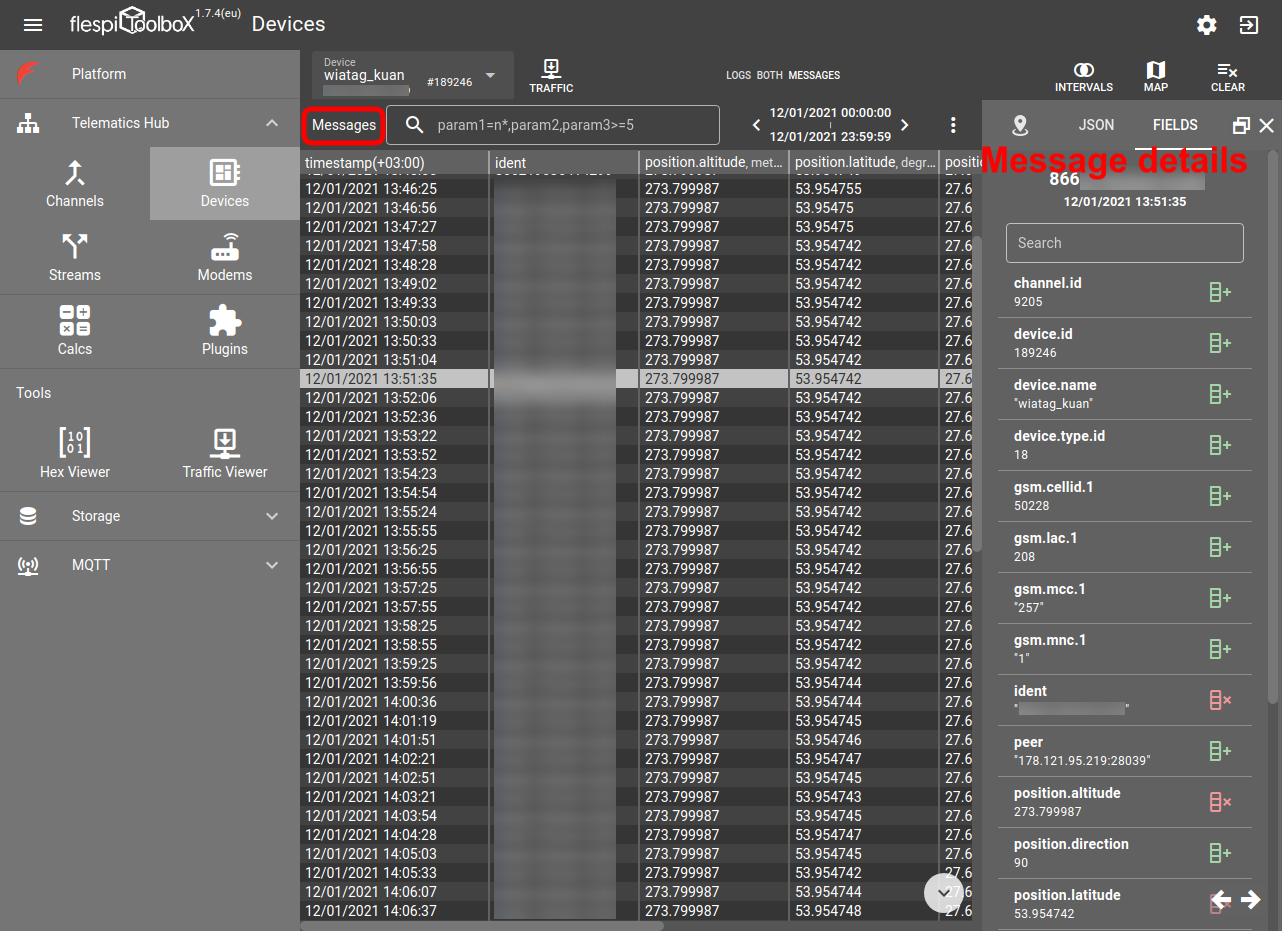
Right sliding pane
Clicking on the message or log entry will open its detailed view in the right-side pane. The pane also allows seeing the message as a JSON object and see the map with the location received in the respective message parameters (position.latitude and position.longitude):
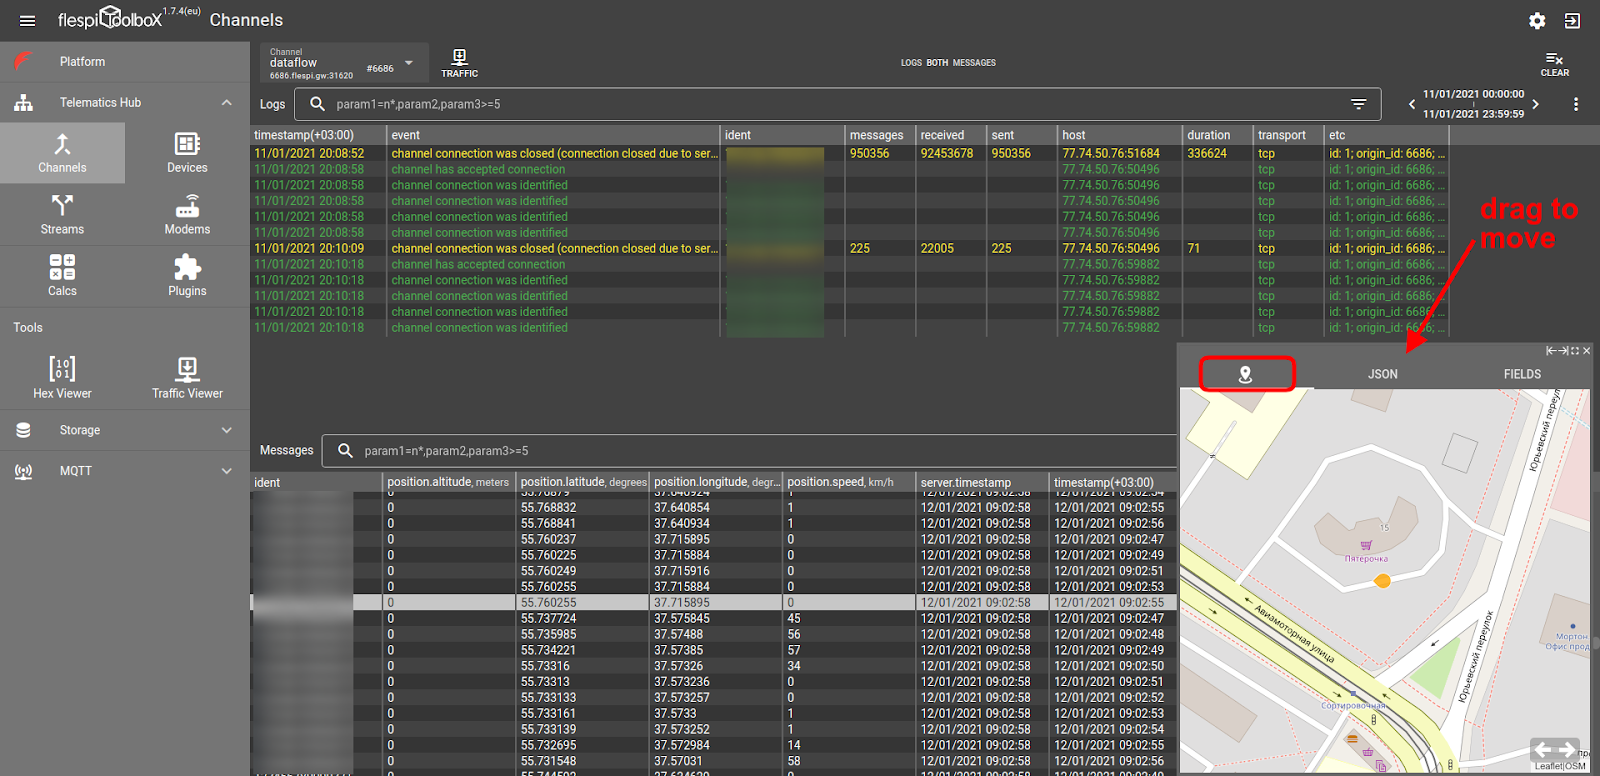
You can detach the pane and move it to any position on the screen:
Columns management
Add/remove columns
You can customize the set of displayed columns and their order.
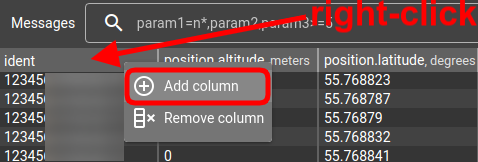
To add a new column, right-click anywhere on the table header and pick Add column.
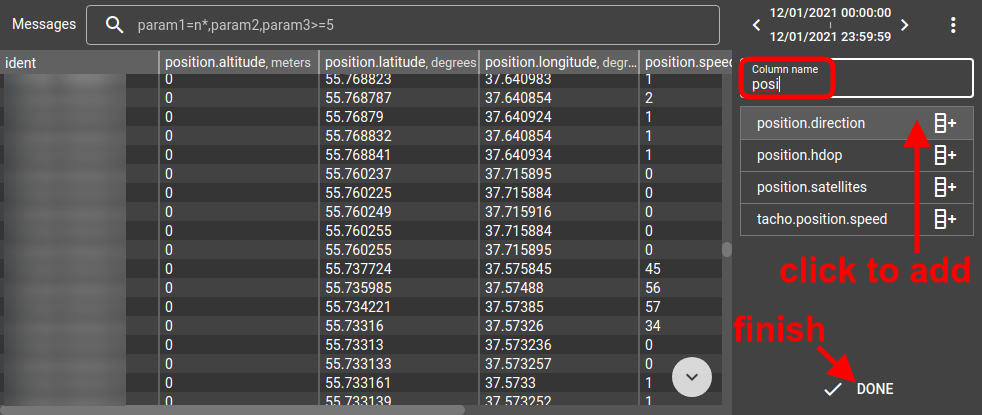
Then start typing the column name and pick the needed column from the list:
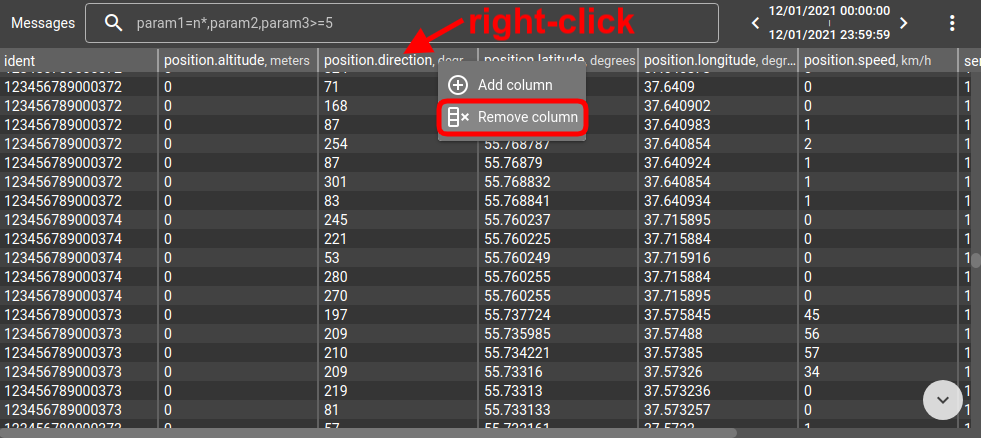
To delete a column right-click on its header and pick Remove column:
Drag the column by its header to change its position in the table.
Column presets
Use the three dots menu to the right of the date picker to revert to default columns or to columns defined by the protocol schema.
Once you configure the columns layout differently from the default setup, you will be able to save your own column preset.

Logs pane
Logs pane is available for ALL item types. Logs include entries about all the events associated with the specific item. The colors of log records are intended to drag attention to more important events (usually related to the modification, deletion, errors, and warnings).
All logs are automatically ordered by timestamp and there is no possibility to change their sort order. However it is possibly to use ApiBox to sort logs retrieval API call result by any column.
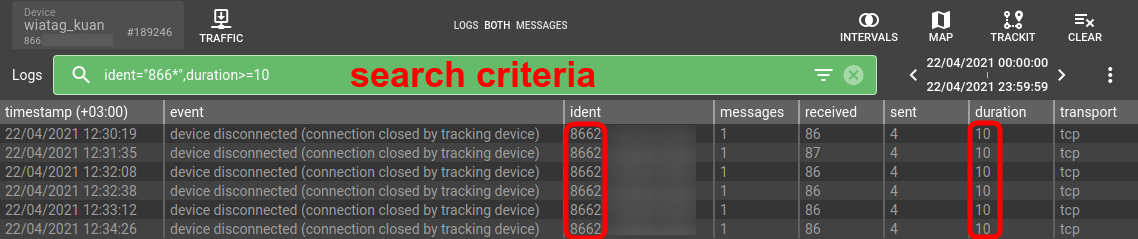
Searching logs
Use the search bar to narrow down the log records to a subset meeting specific criteria. In the search bar you specify filter value using flespi expressions format over log message parameters. Search by any parameter(s), use logical operations (==, !=, >, <=, etc.) and wildcards (*). Use the quotation marks for string values. To apply AND when listing multiple criteria separate them with "&&". To apply OR logic separate criteria by "||".
Note that the parameter name you need to specify in the search bar may not be the same as the parameter column header. You can find the proper name in the log record or message JSON.
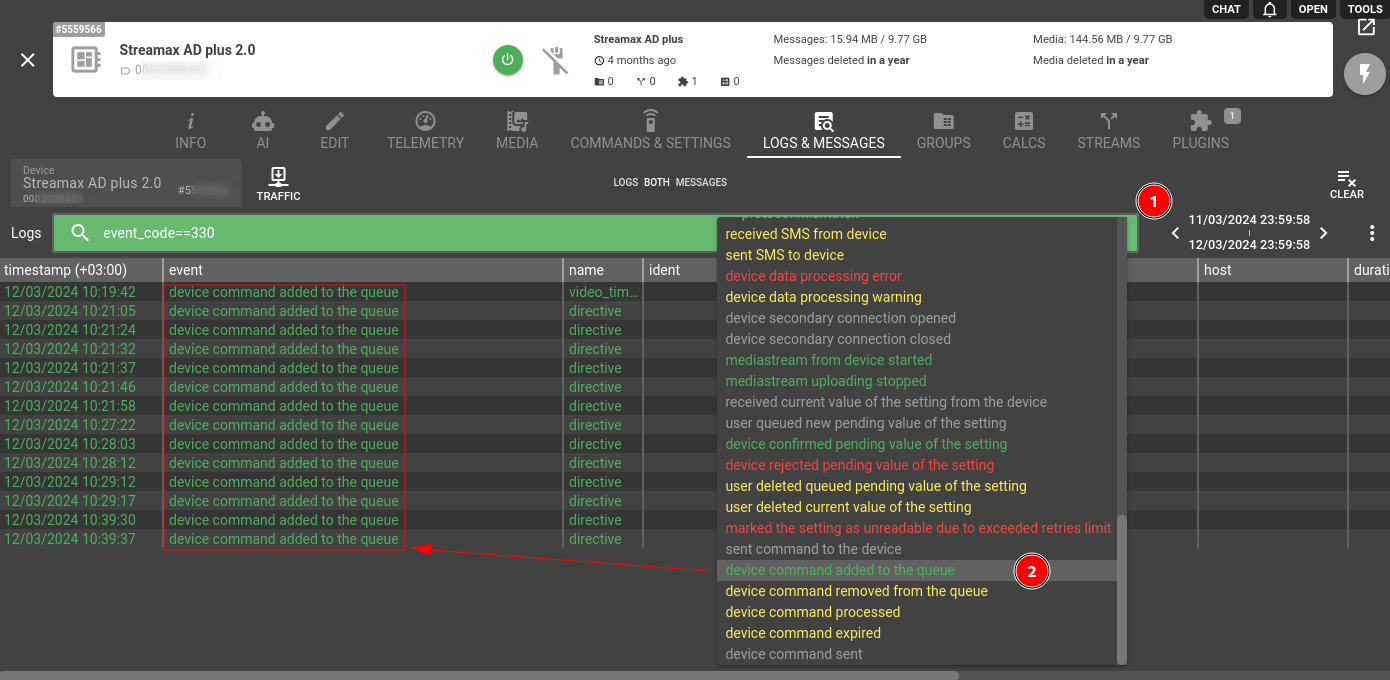
Filtering logs
Filter logs by event type to get only the records you care about - click the white 'funnel' icon in the filter bar and select the event from the drop-down menu:
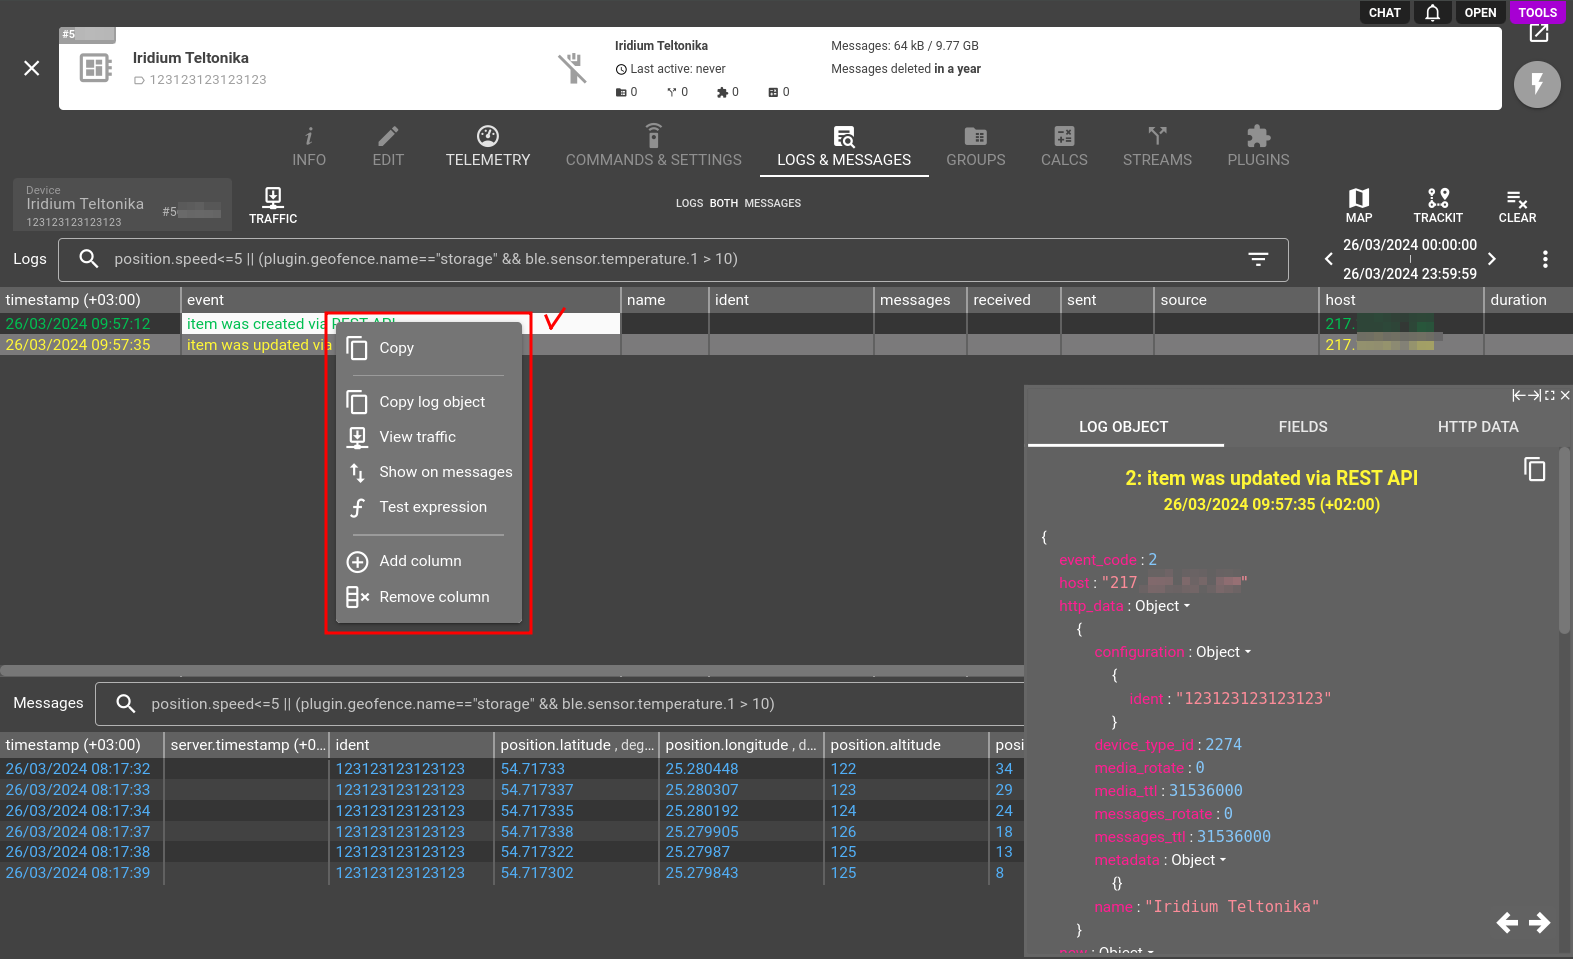
Context menu
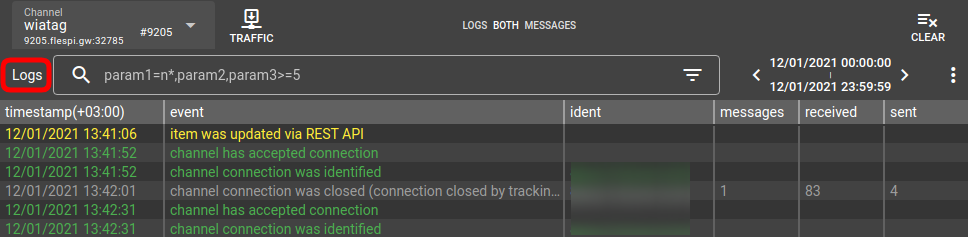
If you right-click on a log entry on the Logs pane you’ll get the following options:
Copy - copies the value of the selected log entry (e.g., ‘item was updated via REST API’).
Copy log object - copies all the messages related to this entry in JSON format.
View traffic - switches to ‘Traffic’ view mode.
Show on messages - syncs this log entry with the messages in the ‘Messages’ pane below.
Test expression - provides quick access to the Test Expression tool where you can validate an expression against a specific dataset.
Add column, Remove column - allows you to add or remove a column from the list.
Messages pane
Messages pane shows the messages received from the physical device or OEM platform parsed according to the protocol specification. The default set and order of the displayed column depends on the protocol schema and can be customized at any time.
All messages are automatically ordered by timestamp (or by server.timestamp for channel messages) and there is no possibility to change their sort order. However it is possibly to use ApiBox to sort messages retrieval API call result by any column.
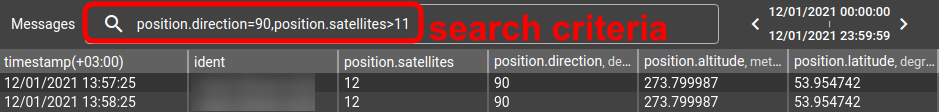
Searching messages
Use the search bar to narrow down the messages to a subset meeting specific criteria. In the search bar you specify filter value using flespi expressions format over message parameters. Search by any parameter(s), use logical operations (==, !=, >, <=, etc.) and wildcards (*). Use the quotation marks for string values. To apply AND when listing multiple criteria separate them with "&&". To apply OR logic separate criteria by "||".
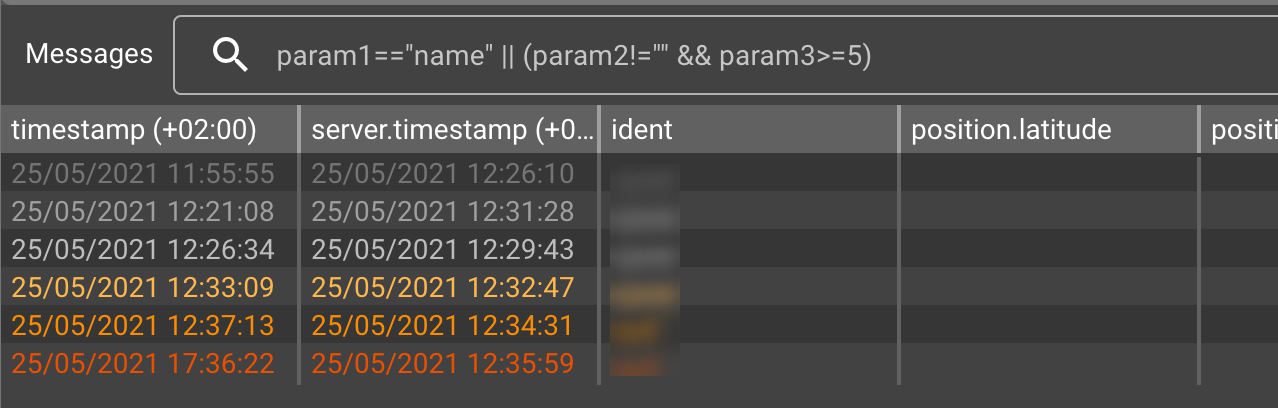
Message colors
Toolbox color-codes device messages depending on their "freshness":
- grey come from the past (flushing blackbox or wrong device settings); the darker grey means farther into the past
- orange come from the future (wrong device settings); the darker orange means farther into the future
- white come from the present (soon after the device records the data)
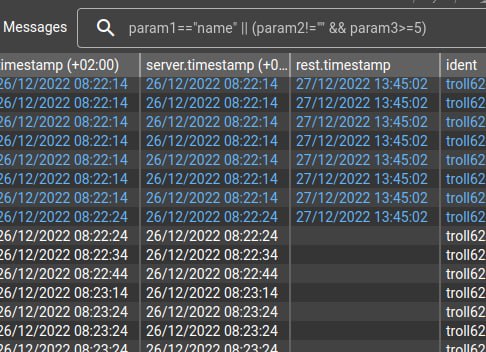
- blue messages are re-registered manually
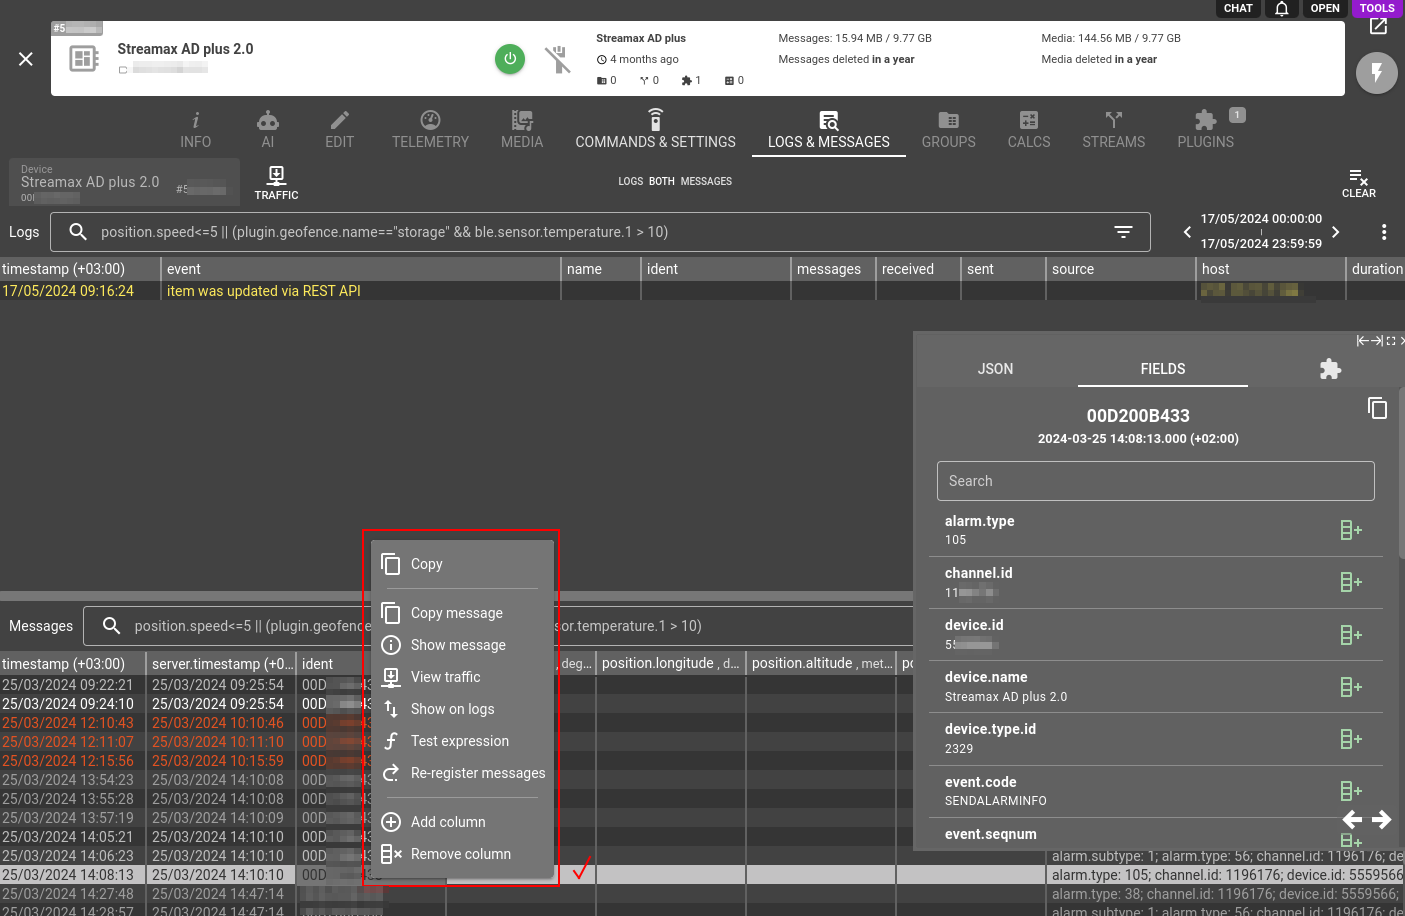
Context menu
If you right-click on any message on the pane you’ll get the following options:
Copy - copies the value of the message for the column pointed to the clipboard.
Copy message - copies all the messages in the line in JSON format.
Show message - shows the JSON payload for this message.
View traffic - switches to ‘Traffic’ view mode.
Show on logs - shows the current message payload in the Logs pane.
Test expression - provides quick access to the Test Expression tool, where you can validate an expression against a specific dataset.
Re-register messages - allows you to re-register the selected message.
Add column, Remove column - allows you to add or remove a column from the list.
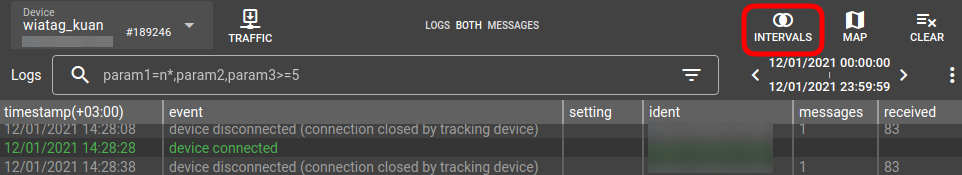
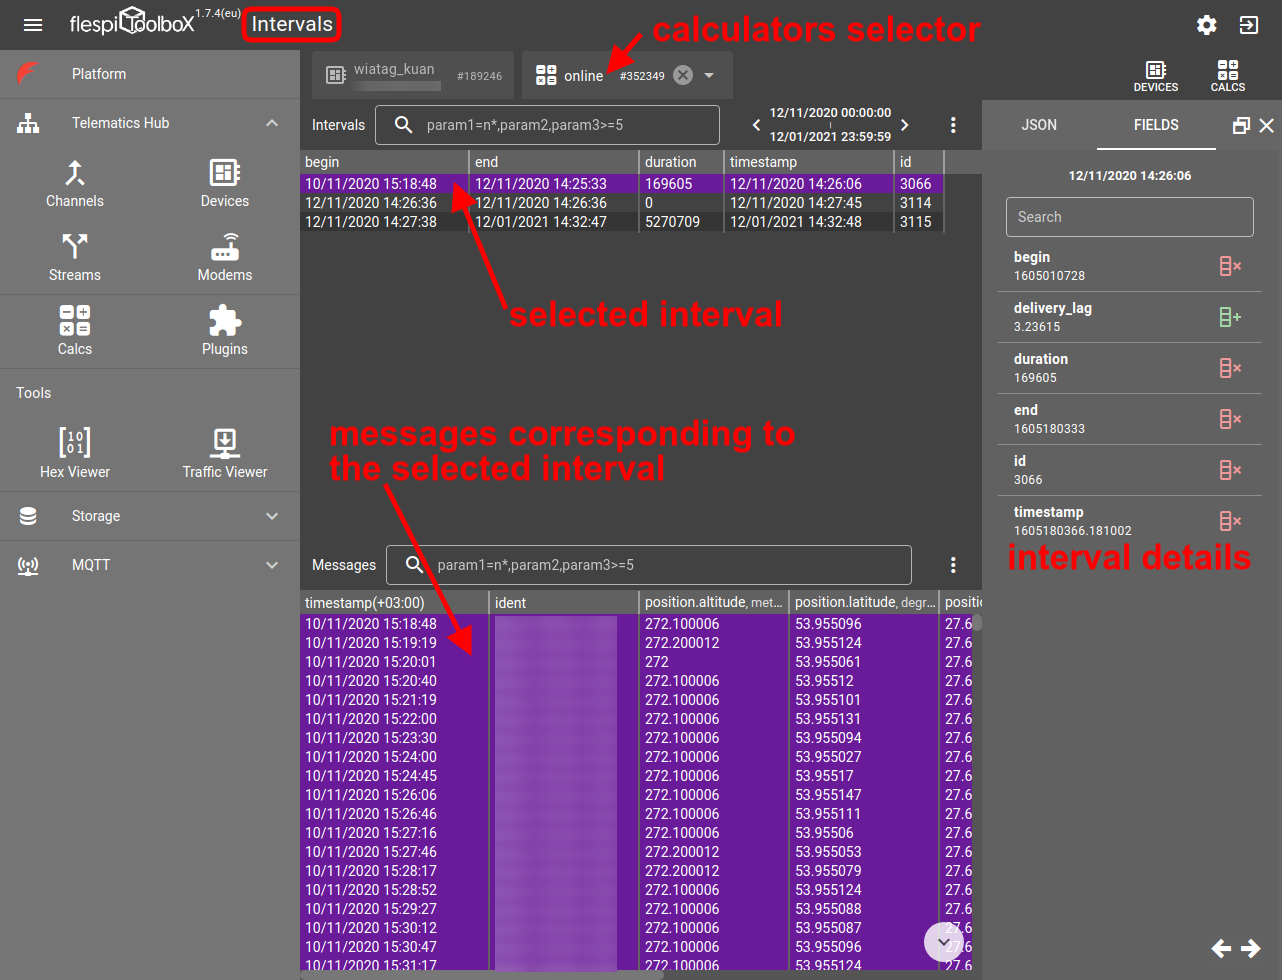
Intervals
Intervals are a different entity generated based on multiple messages. Intervals have a separate view available for devices with assigned calculators only:
Once in the Intervals mode, you should pick the desired calculator assigned to the selected device to see the intervals for:
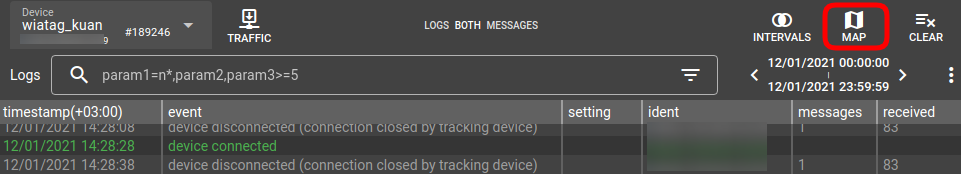
Map
A built-in map for quick dot-on-the-map visualization is available for devices only (since they correspond to the vehicles or assets being tracked).
You can click on the Map button at the top right of the screen to see the last position of the current device based on its position.latitude and position.longitude parameters stored in telemetry.
Tools
Toolbox has a few complementary tools that may be helpful for advanced debugging and troubleshooting.
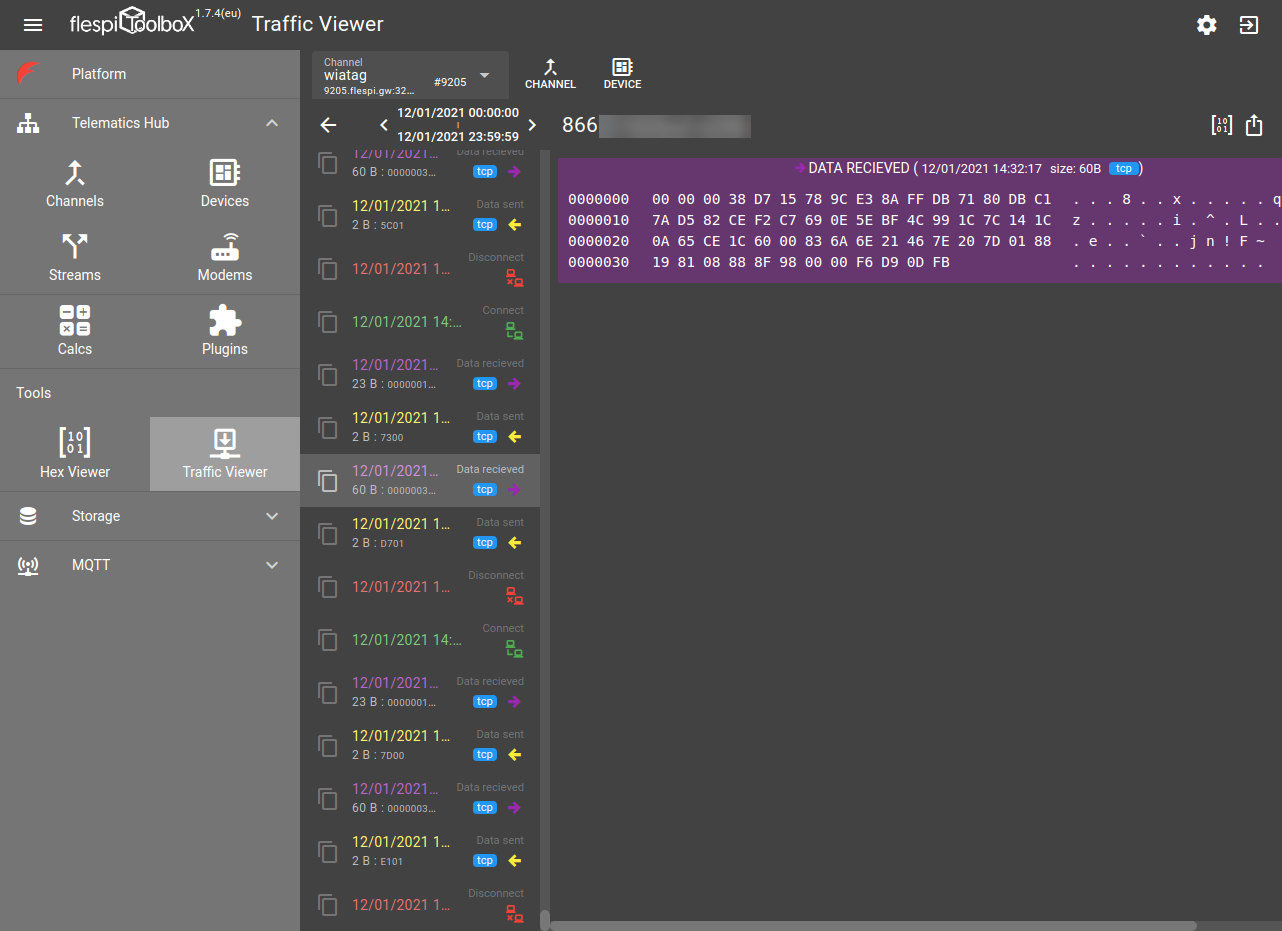
Traffic Viewer
Traffic Viewer is a handy tool to analyze raw messages from any IoT and telematics devices (supported in flespi).
You can see the raw traffic data for any channel or device in your flespi account:
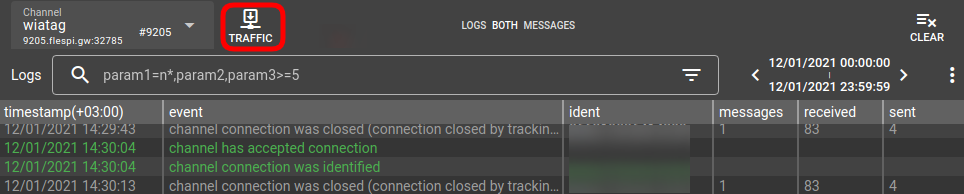
When opening Traffic Viewer for a channel, you will be prompted to pick the specific ident to show the traffic for.
Read more about the tool here.
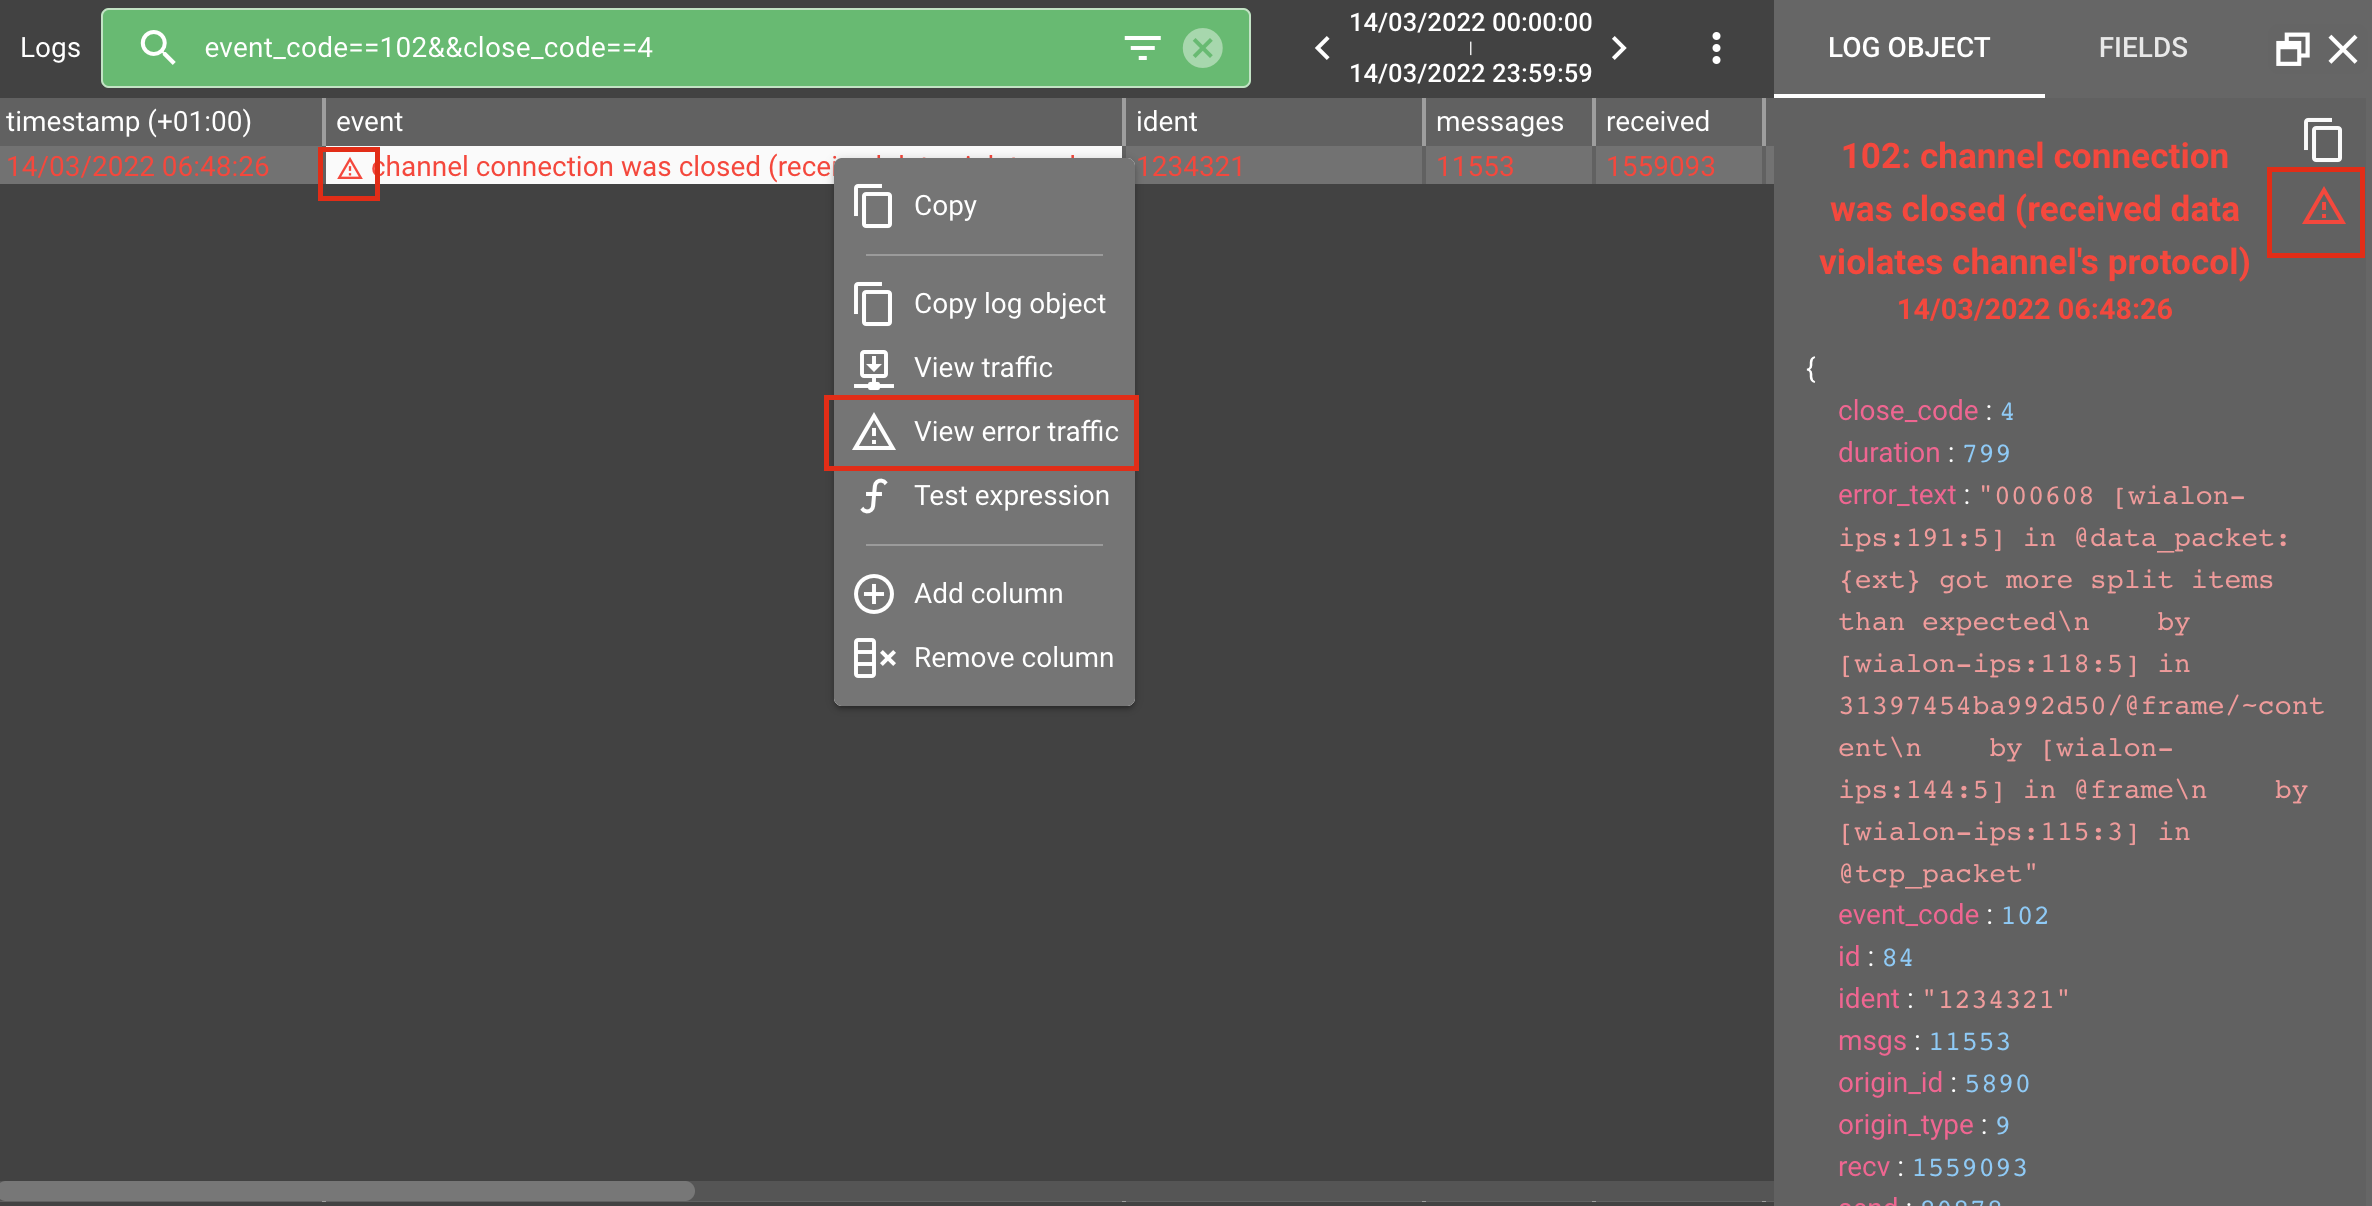
Error traffic viewer
This is a special breed of traffic viewer that highlights the traffic related to a specific parsing error. Right-click on the error message in the Logs pane and select View error traffic in the context menu:
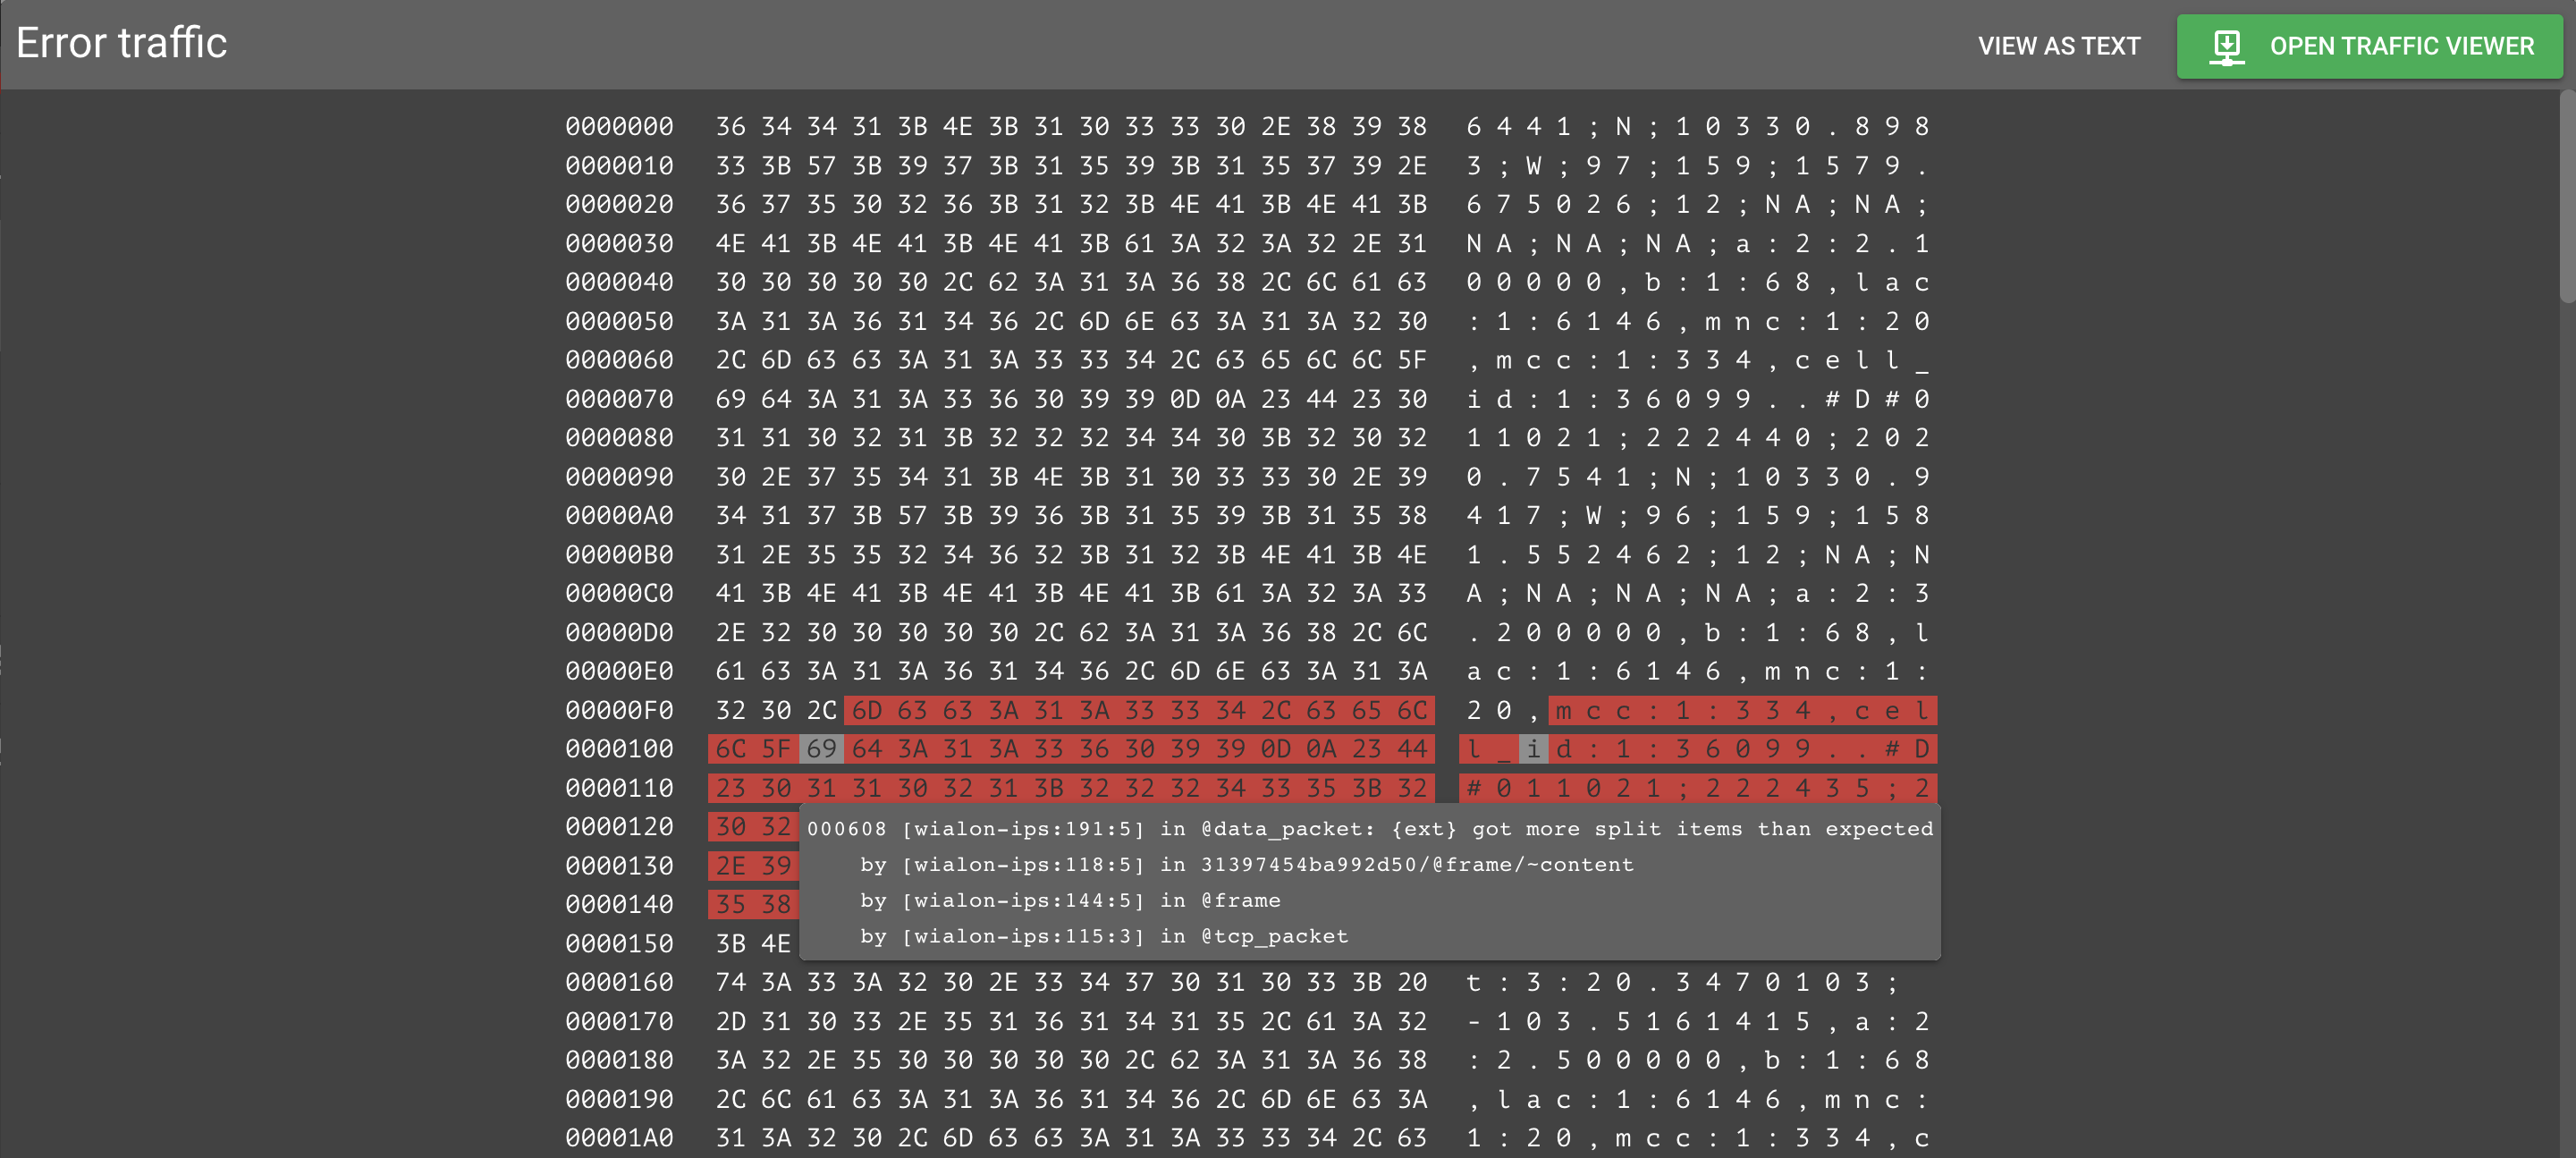
The raw error traffic will be highlighted in red:
HEX Viewer
This tool works for proxy channels only and allows investigating data packets in raw hexadecimal format with more convenience. Check the dedicated article here.
***
Despite being such a powerful and multi-functional tool, Toolbox will be getting occasional updates when our developers implement their new bright ideas. To stay in sync with the latest changes, subscribe to the Toolbox change log on our forum.