UPDATE Learn how you can view and export raw traffic data in a variety of formats
flespi is not just a high-performance backend platform for streamlined telematics development, it’s an ecosystem including a number of complementary tools to assist with debugging, device management, support, data visualization, etc.
For quite a while, you’ve been able to see raw traffic in the proxy channel that is heavily used for debugging and forking the data stream to multiple destinations.
Now the raw traffic data from ALL messages are available for ALL your flespi channels in the Traffic Viewer tool.
Note: the traffic viewer will only work for connections with correctly parsed device identifiers, i.e. viewing arbitrary traffic not based on the flespi-supported protocol will not work.
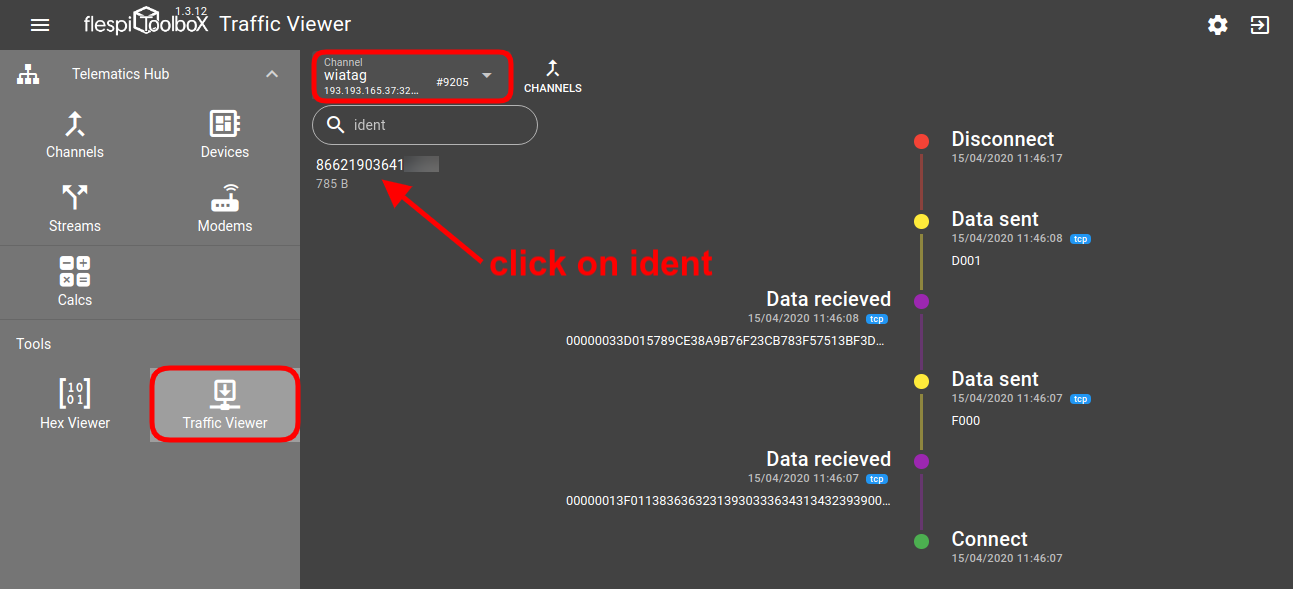
Go to Toolbox, and click the Traffic Viewer item in the left-side menu.
Then you pick the channel from the drop-down on top. The list is populated with idents of connected devices sending data. Once you see the ident you want to see the raw traffic for, click on it and you will see the detailed info about all packages received from the device:
Alternatively, you can open Traffic Viewer directly from the Logs & Messages tab on the target channel card:
or from the specific device card:
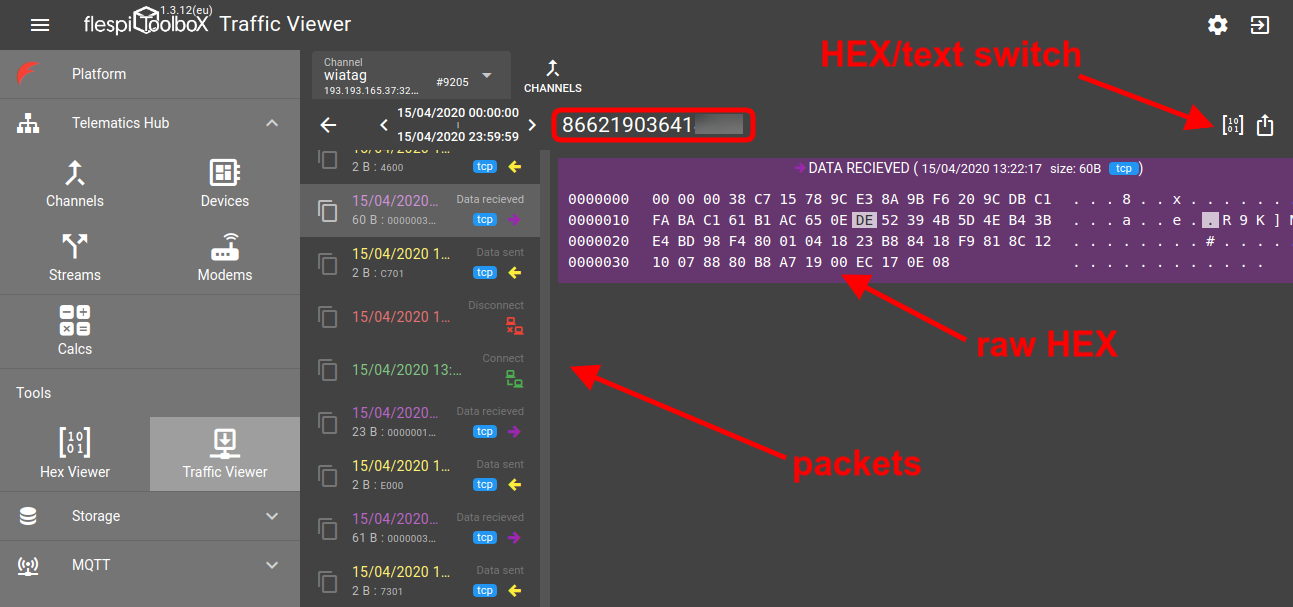
When you click on the packet, you see the raw HEX traffic and its respective text representation.
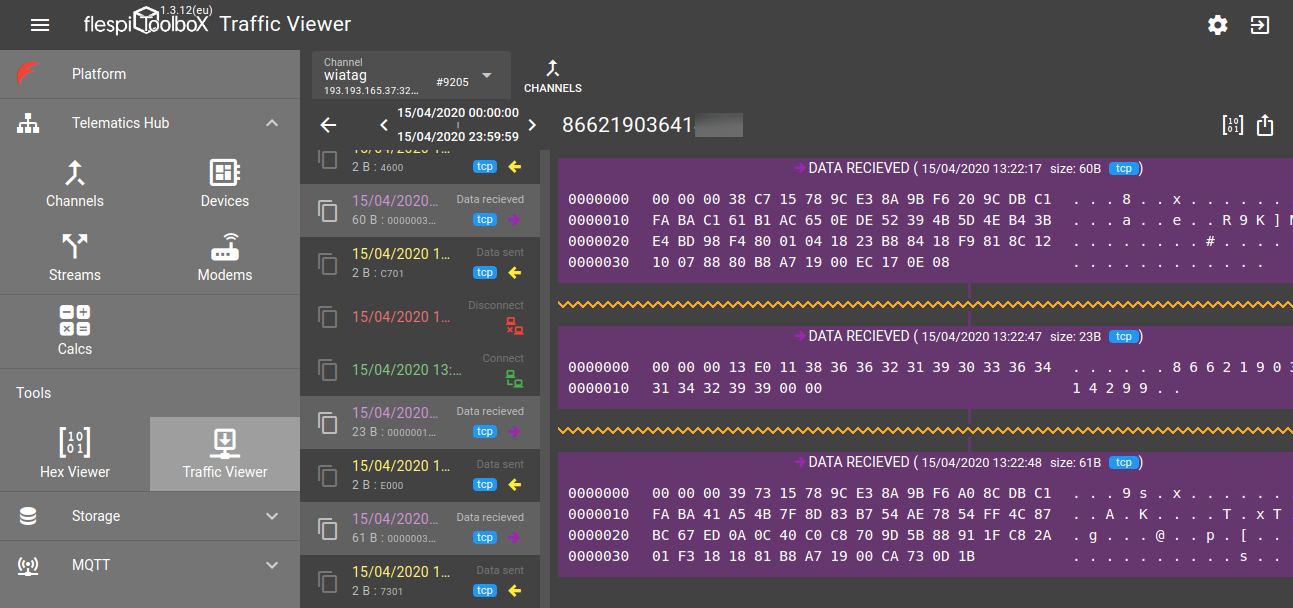
You can Ctrl+click on several packets to see their content simultaneously on the screen:
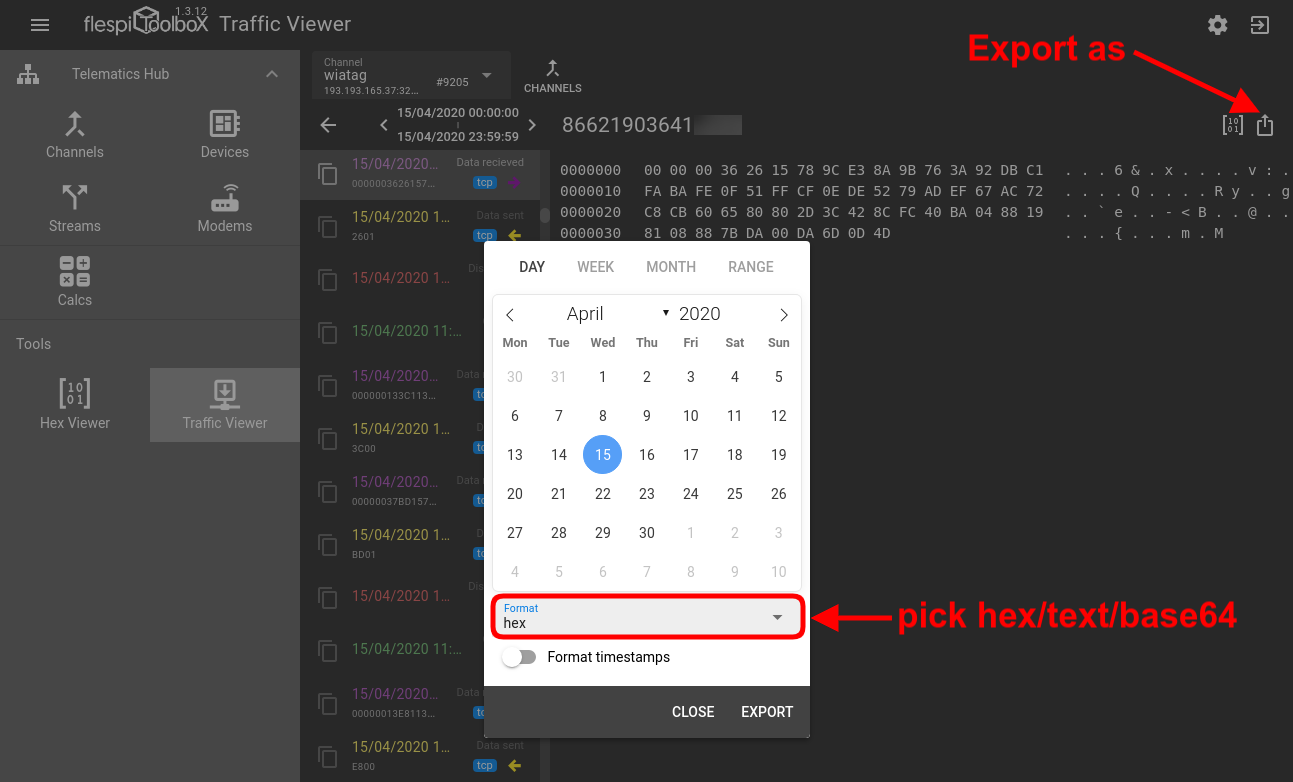
You can export the received messages for the specified period as HEX, text, and base64 by clicking the Export as button:
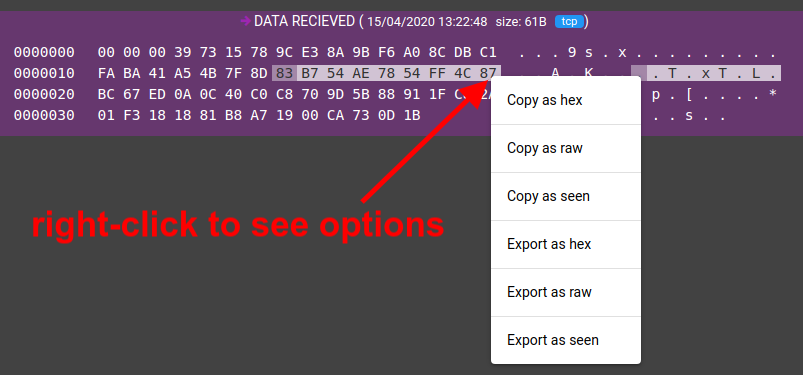
Right-click on the selected block of text to open a rich context menu with a variety of Copy as and Export as options:
You can also copy the JSON of each packet by clicking on the Copy button on the left of the packet in the list.
***
Oftentimes looking into the raw traffic may be insightful when debugging communication issues with the GPS tracking device. Hope, flespi traffic viewer will become an essential tool for many engineers working in telematics.
