The recent release of the flespi automatic real-time analytics engine started a new era in flespi history. Now you can not only aggregate the data from tracking devices and forward it to the target addressees but also do advanced calculations over the collected telemetry messages, apply complex logical patterns, and end up with a set of intervals meeting the specific criteria.
When I looked at the analytics capabilities for the first time, I felt as if I just opened the first page of the “War and Peace” book — somewhat daunted but anticipating the great power and multifacetedness. These feelings pushed me to write this article for the likes of me and give some tangible examples of what flespi analytics empowers you to do.
Beginning
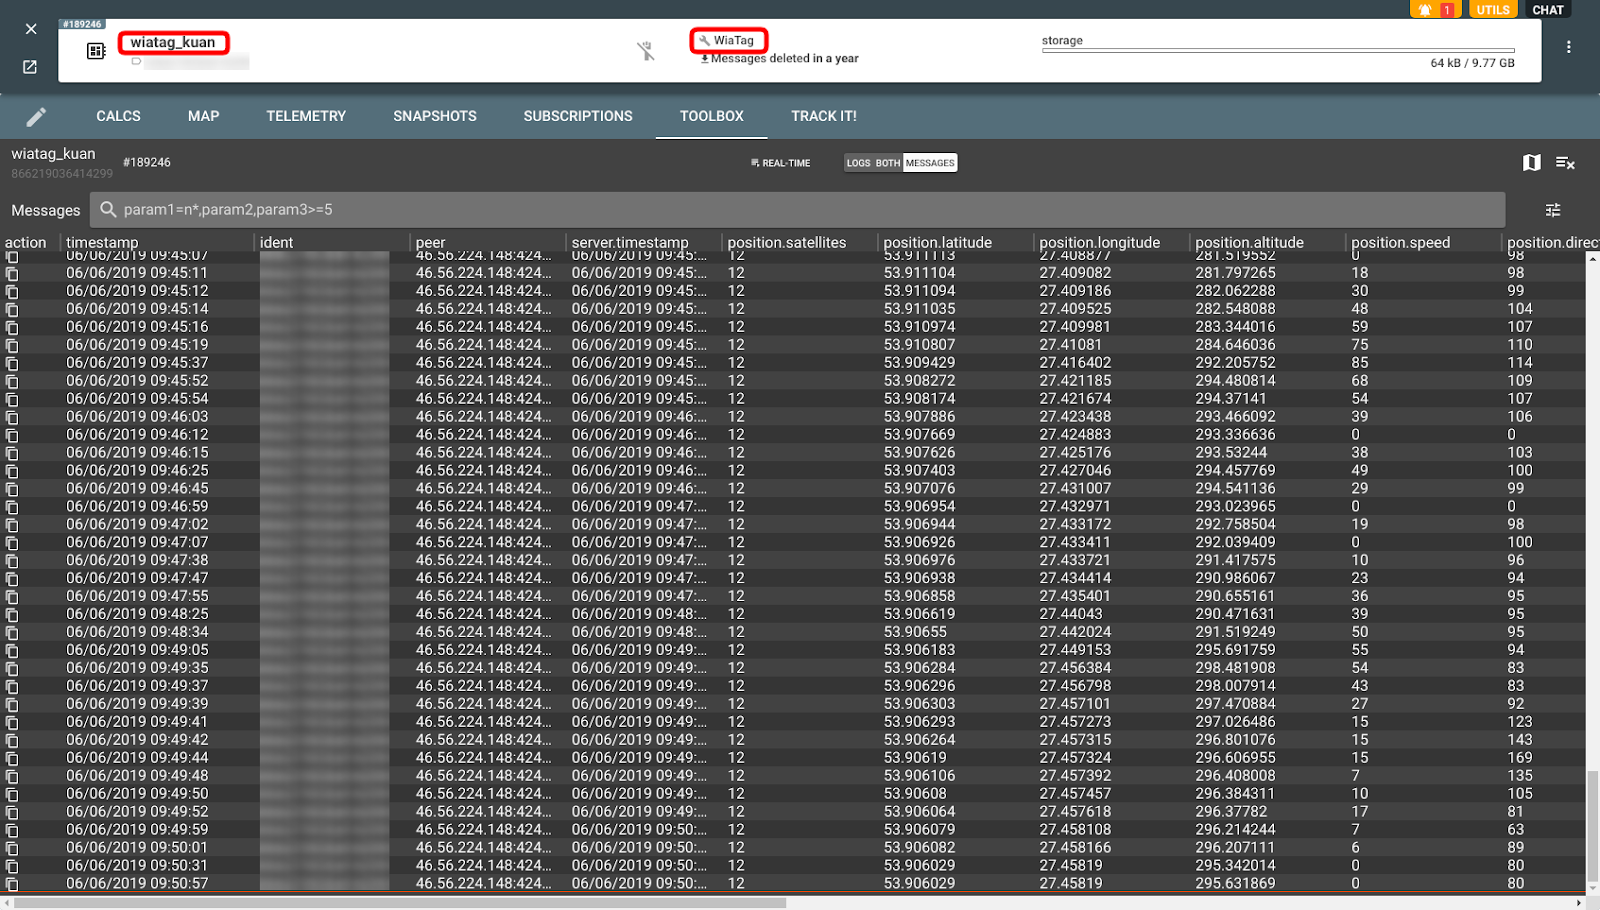
It all starts with having a flespi device that’s getting messages (or has already gotten some — you can perform the analysis of the historical data as well). I will use a software tracker WiaTag for demo purposes here.
Analytics itself
The analytics starts when you decide to process loads of messages you’ve got. Usually, it implies two steps: splitting the messages into intervals and calculating certain aggregate values for the created intervals.
First calculator
Let’s go straight to creating a real calculator and see what’s needed to make it work.
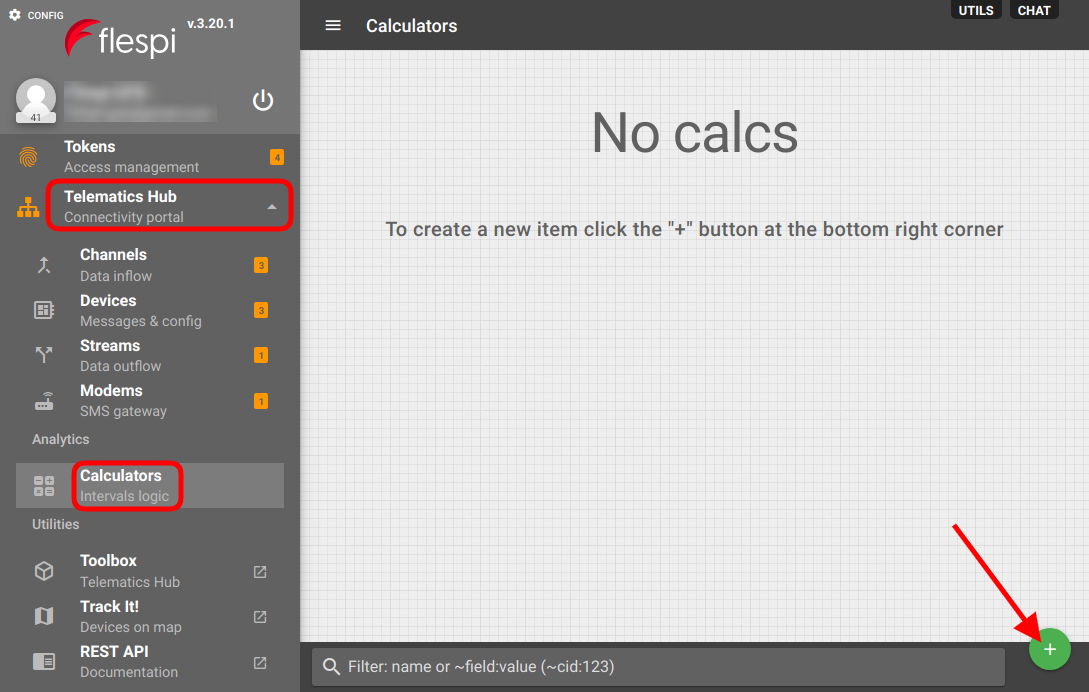
When in the flespi panel navigate to Telematics hub -> Calculators and click the “+” button:
Splitting rules (Selectors)
Selectors are used to define the rules of splitting messages into intervals. It can be a logical expression, e.g. an interval lasts while the estimated value holds true. It can be based on the position relative to a geofence (or geofences), e.g. it counts as a valid interval if you stay inside the geofence for more than five minutes. OR a selector may split messages based on time (datetime), e.g. by month, day, hour, etc.
Note: if you use a datetime selector, don’t forget to specify the timezone parameter of the calculator to ensure accurate splitting.
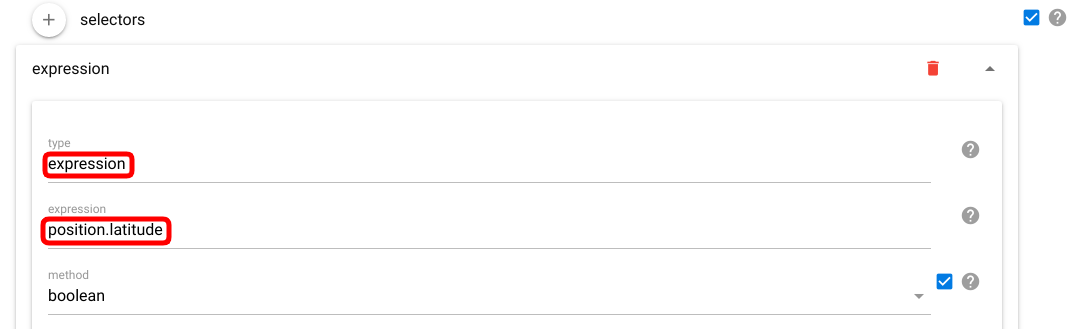
I want to find all stops during my recent trips. For this purpose, I will configure the calculator to check if my speed was < 5km/h.
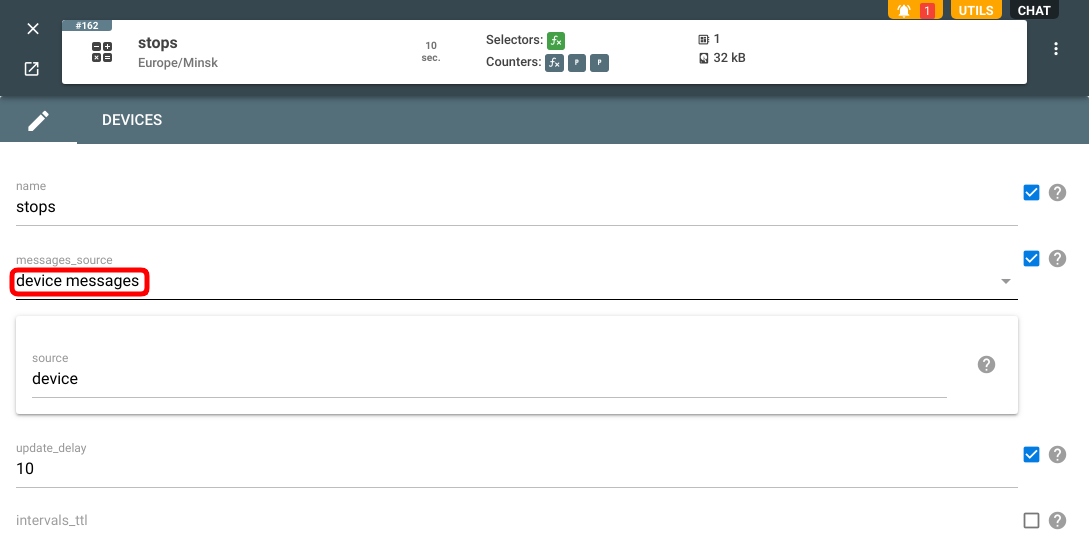
For the first calculator we will use device messages as a messages_source:
And here’s how the selector looks:
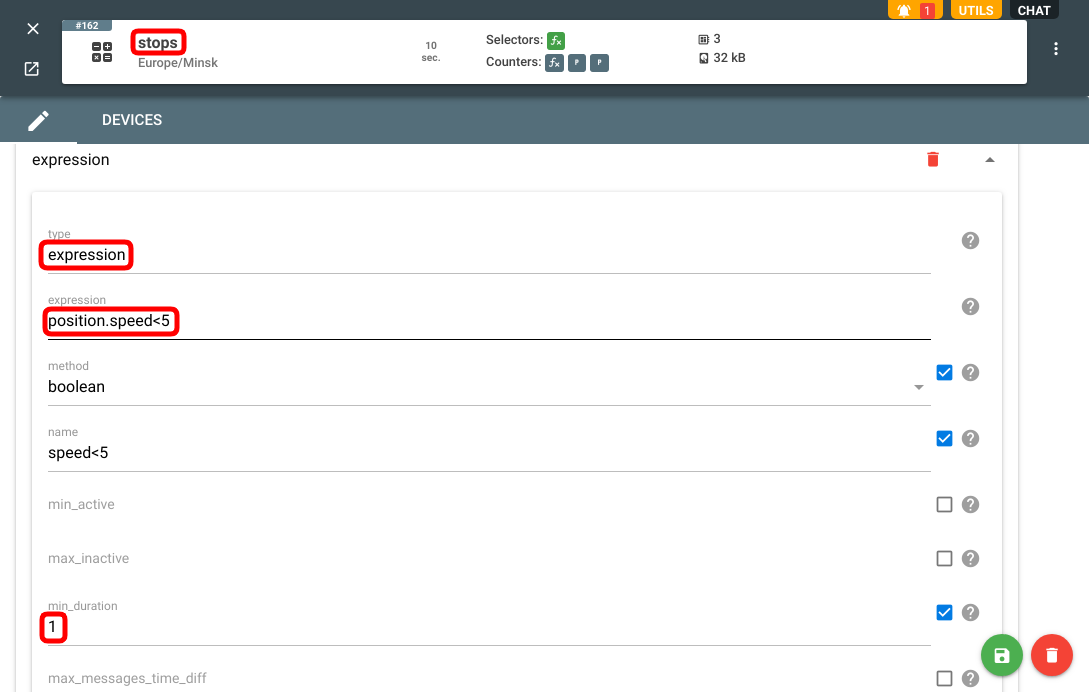
Note that we set the min_duration parameter to 1 to filter out the stops of less than a second.
Computing values (Counters)
Counters allow configuring what values we want to have calculated for each interval once the selectors get applied.
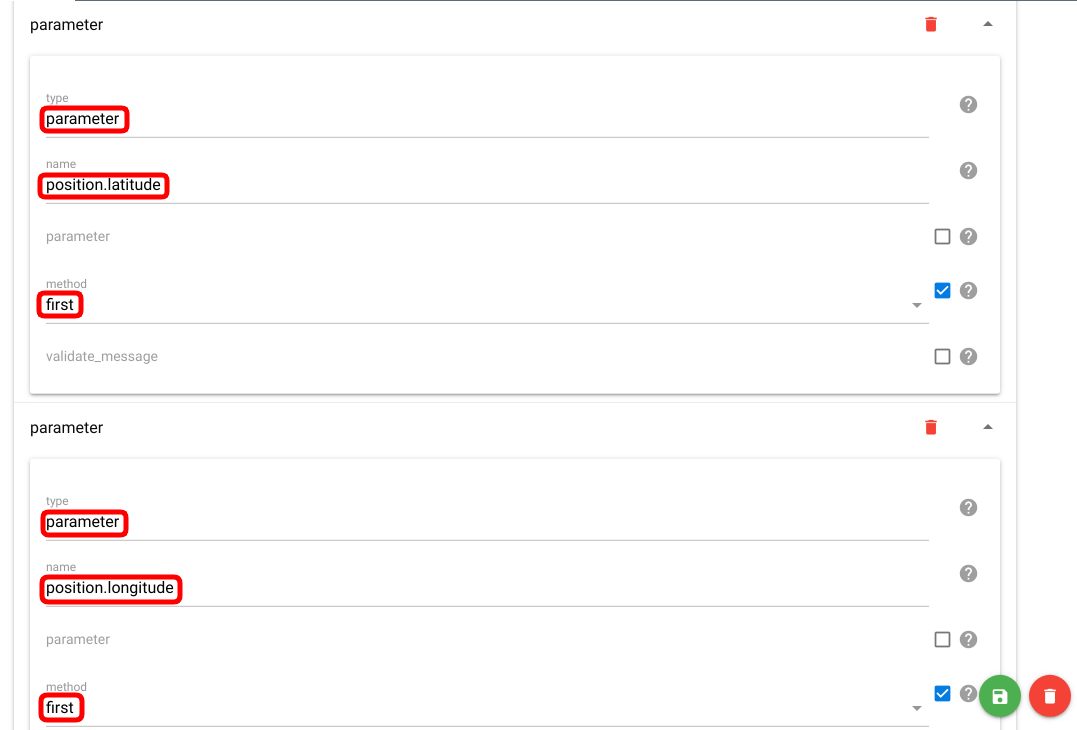
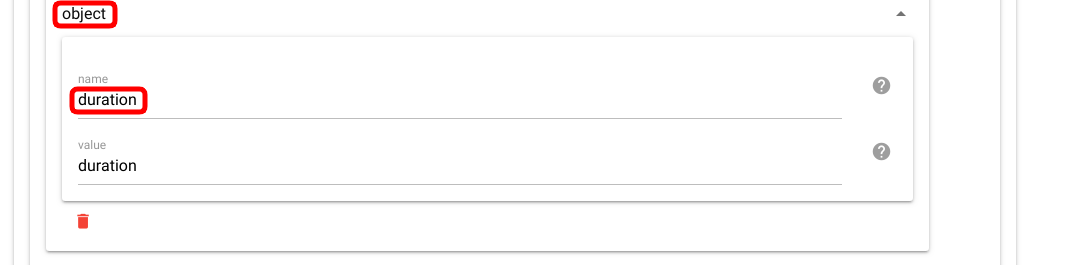
In our first calculator, we will calculate the average speed within each interval — to make sure it’s close or equal to zero (as we are detecting stops). We will also pick the latitude and longitude of the first message within each interval to be able to see where stops occurred. The counters setup is as follows:
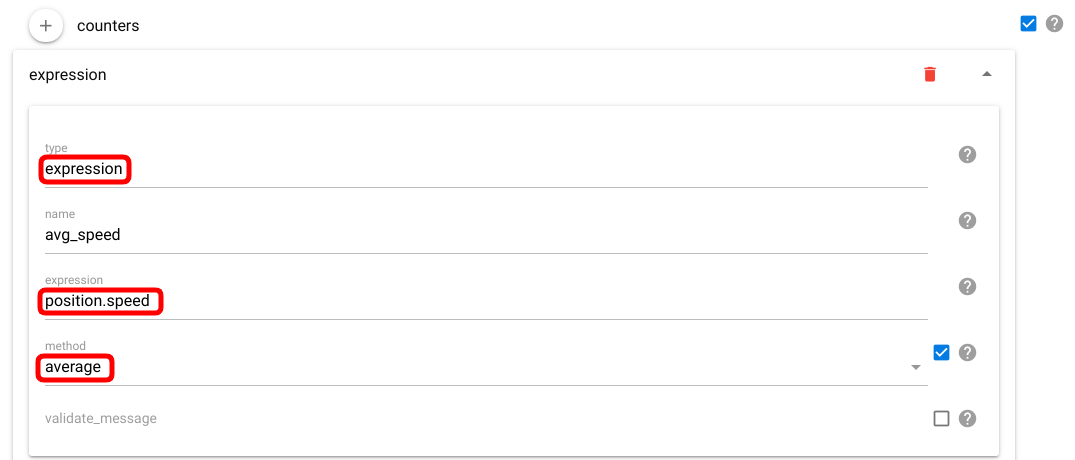
Hint: if you want to use the parameter name in the interval calculations as is, you can put it into the name field and leave the parameter field blank — no need to duplicate it.
Don’t forget to click the green Save button to apply changes to the calculator.
Applying calculators (Assigned devices)
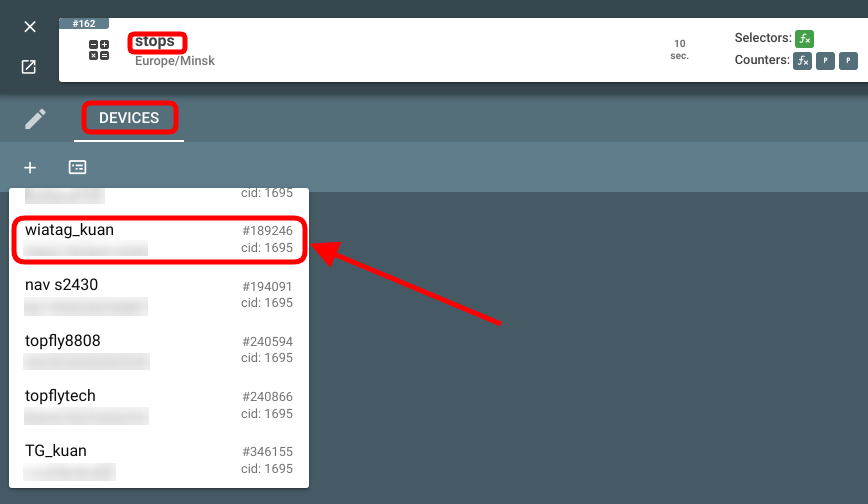
Now that we have a calculator, we need to say which device it should process data for. Click on the calculator card and navigate to the Devices tab:
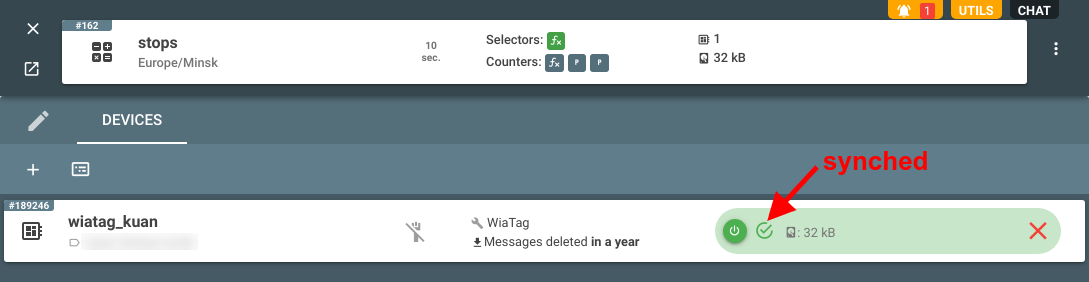
Once the calculator finishes processing the data from this device, you will see the green tick meaning that the device is synced:
Last interval
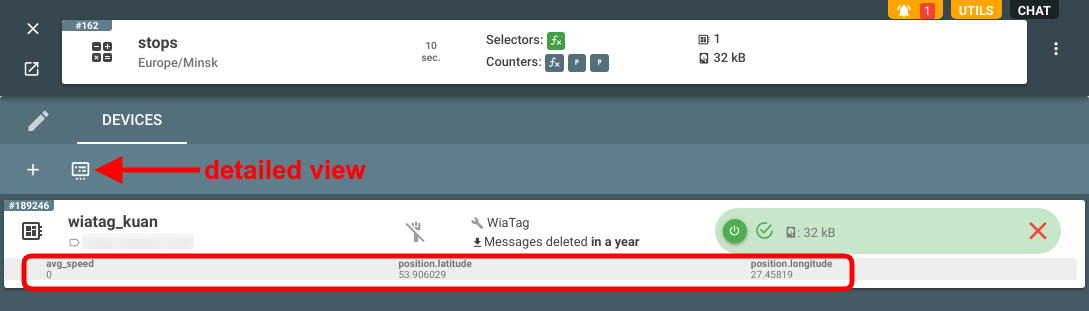
Click on the assigned device card to see a nice dialogue with the last interval values:

As we can see, my last stop was 26 seconds long, the speed was indeed 0, and we see the coordinates of where stop happened.
You can also switch the calculators' cards into detailed view by clicking a button next to the “+” sign:
Another calculator
How about having a calculator use the result of another calculator? No problem.
This time we will use the intervals from the first calculator as a messages_source:

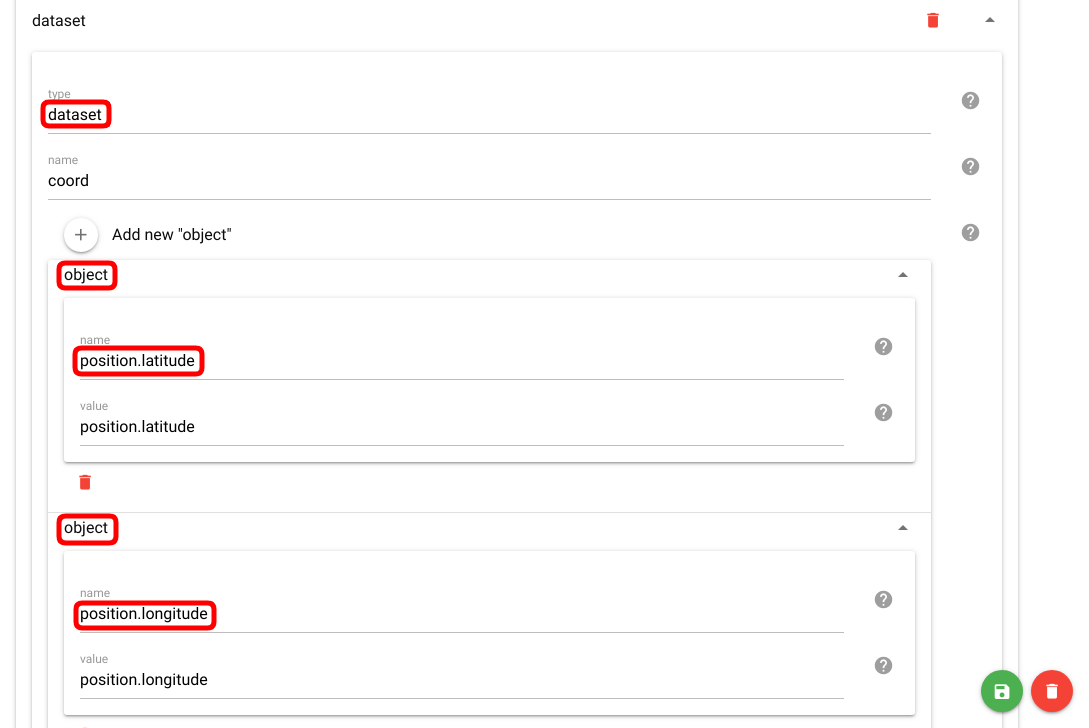
What we want to do is draw a route connecting all stops detected by the first calculator (named “stops”) and form a dataset with the coordinates of each stop and its duration.
The selector here is not that critical since we are not going to detect new intervals here. So we will just make sure that the position.latitude parameter is present — we will need it to build a route.
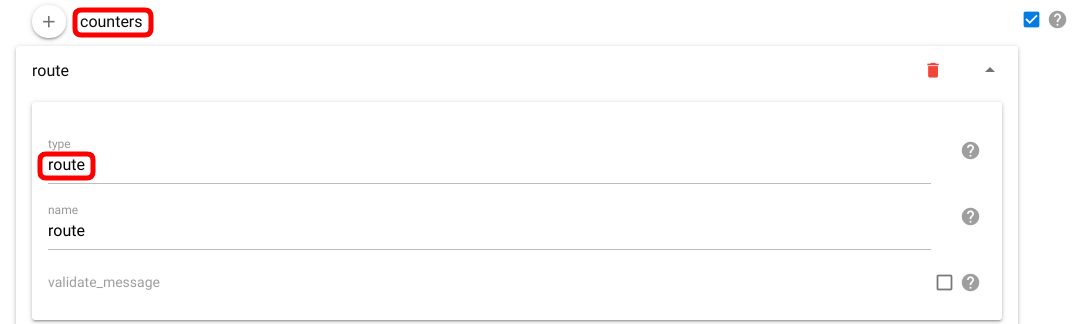
The counter of the route type will automatically pick the position.latitude and position.longitude parameters from the source and generate a track in a Google-encoded polyline algorithm format.
And here are the values for the dataset:
Then we assign our device to this calculator in the same way as we did for the first calculator. Then let’s click on the assigned device card to see the results of the calculations:
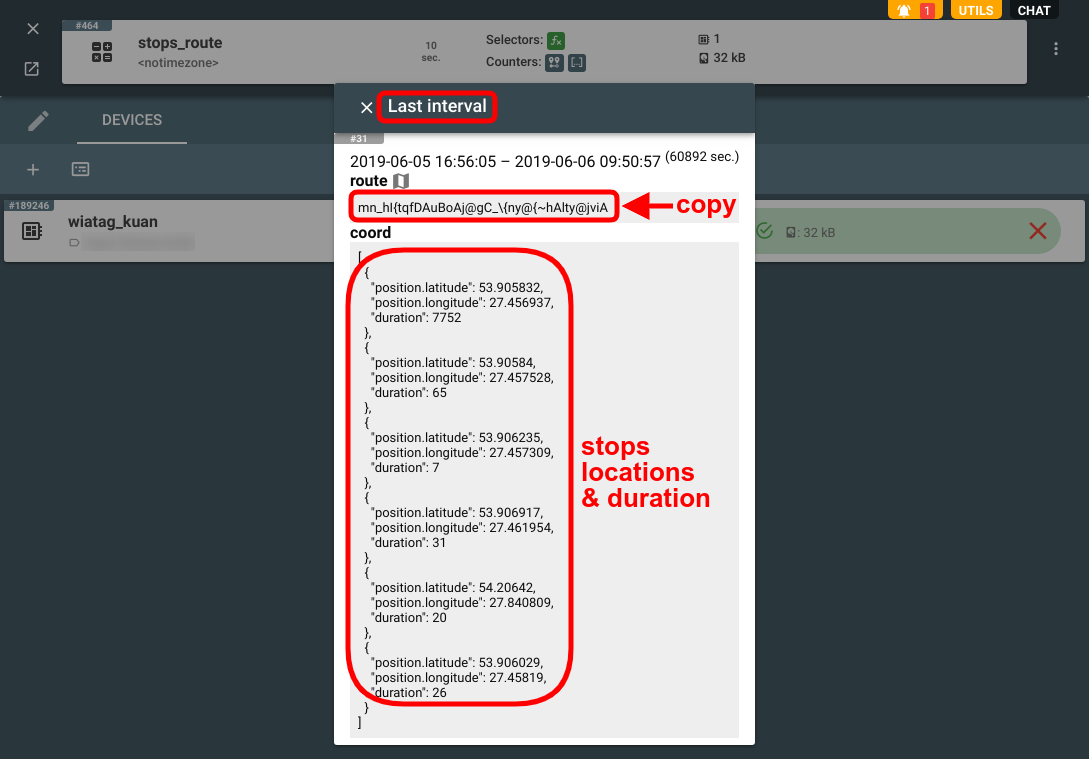
We get an array of all stops including their latitude, longitude, and duration.
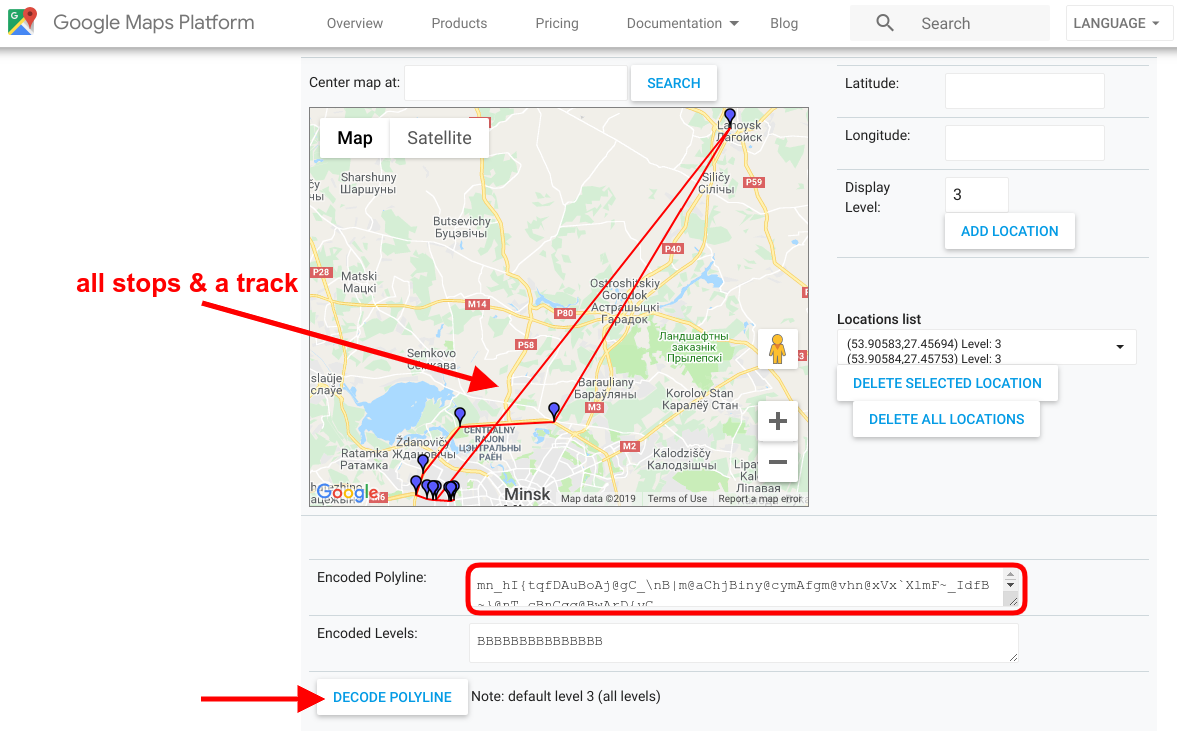
If we copy the Google-encoded route and paste it to the Google polyline utility, we can see all my stops on the map with a track connecting them:
Yet another calculator
This is the last one, I promise ;)
What if we want to narrow down our list of stops to the short stops only — say, to the ones longer than 5 seconds and shorter than 300 seconds (5 mins).
Let’s create a calculator that will use the results from our first (“stops”) calculator:

Then we’ll instruct it to select only the intervals with a duration between 5 and 300 seconds:

Note that we set the max_messages_time_diff parameter to 1 to prevent merging of subsequent intervals if they are more than a second apart.
Fetch intervals
Let’s use flespi API to get the calculated intervals for our last calculator (“standings”). Go to the Utils (top right of the screen) and pick Documentation:
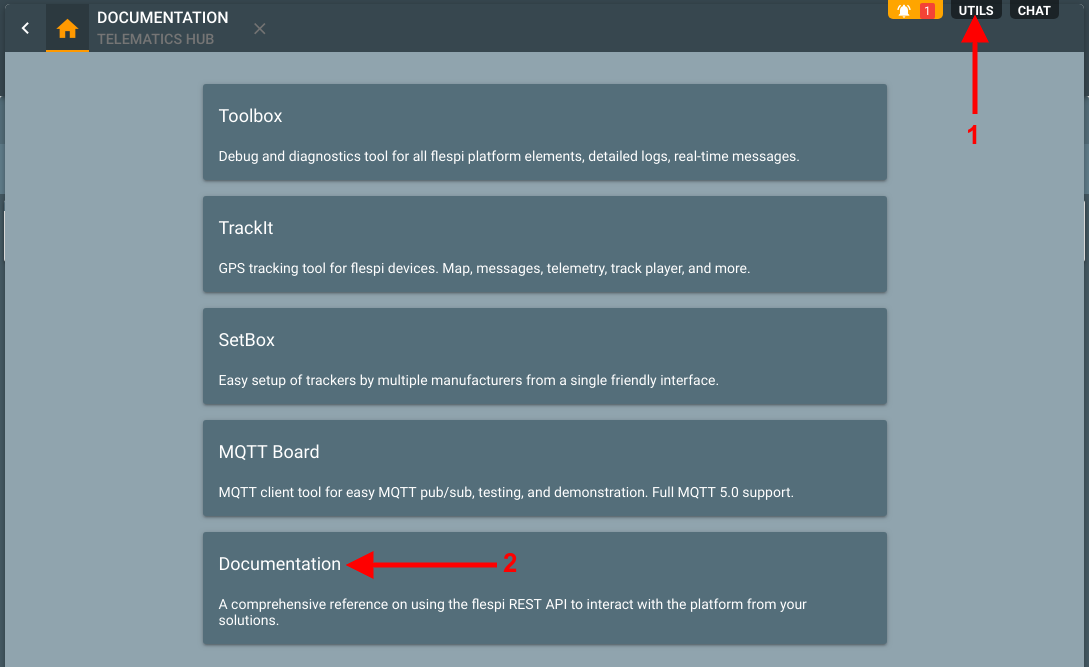
Navigate to Gateway API -> Calculators -> GET calcs/{calcs.selector}/devices/{calc.devices.selector}/intervals/{calc.device.intervals.selector}. Enter the calculator ID into the calcs selector and click Try it out! button:

And we get an array of all our stops longer than 5 seconds and shorter than 5 minutes. Obviously, you can access them via the REST API from your application and utilize for your purposes.
***
Well, this is the end of chapter one. Hope we managed to hook you and inspire to try the flespi analytics to a greater extent. We will keep publishing articles illustrating different capabilities of the analytics engine to help you realize the vast opportunities it offers. Stay tuned.