Just recently we have released the first edition of the flespi analytics engine — the manual mode that allows performing the calculation of intervals and desired values within the intervals upon request. This option was mostly used by developers.
We also promised to get back soon with the automatic mode. And it’s already here!
Now it is possible to extract real-time intervals from historical and incoming device messages, calculate aggregated values for them based on custom logic, store results in persistent storage, and present to the user via REST API. The analytics engine also generates a set of MQTT events that can be used by third-party developers interested in utilizing the engine.
In addition, the automatic analytics system got the UI implementation in the flespi panel with Toolbox integration coming soon. This means that you can play with it using just mouse and keyboard. And it doesn’t require any technical skills.
To visualize the results of the automatic calculation engine instead of using REST API directly, you can use Toolbox for detailed diagnostics, MQTT Tiles to render the current/last state of intervals directly to the mobile on the shared dashboard, and MQTT Board for those who want to handle MQTT events occurring with the assigned device.
Possible uses
Some tasks can be solved using flespi analytics with the help of visualization of last detected interval in MQTT Tiles and do not relate to any kind of development, e.g.:
Visualize information about the current state of any activity like trip, parking, geofence position, any input control on a dashboard.
Visualize information about any activity over a date range on a dashboard — for example, daily or monthly mileage, driving time, average speed, how many trips between multiple locations were done or how many delivery orders were completed.
Note that these activities are already calculated and are being recalculated automatically when the device sends more and more messages (even from the black box far from the past). The results are available instantly — within one millisecond — for the entire fleet of 10, 100, 1000 or even tens of thousands of devices. Amazing, isn’t it?
What else?
If you are involved in software development dealing with GPS-equipped telematics or IoT devices, you will always need to process and calculate data from them. Always. Whatever the task may be. Now you can delegate this job to flespi and concentrate on things flespi cannot do — like connecting a custom database to the calculated data or adding logic on top of it.
If you have read ReadyMixTracking article about how utilization of flespi analytics engine in manual mode improved system performance 100x times comparing to the calculation in AWS instance, you can imagine what further improvement the automatic intervals calculation will bring in terms of cost decrease and simplicity of application implementation.
With automatic calculation engine you can rely on flespi to detect any state change, any movement in inappropriate areas, any alarm situation. You do not need to check each message to activate or deactivate its alert status — flespi will inform you in real time when the new interval is created, updated or deleted upon new data receipt. This is a perfectly organized notifications engine operating based on the logic configured by you.
Setting up automatic analytics
To activate the automatic analytics engine in flespi, follow these steps:
Create channels that will serve as entrance points for incoming data from telematics devices.
Connect telematics devices to the respective channels.
Register virtual flespi devices and assign them the correct device type.
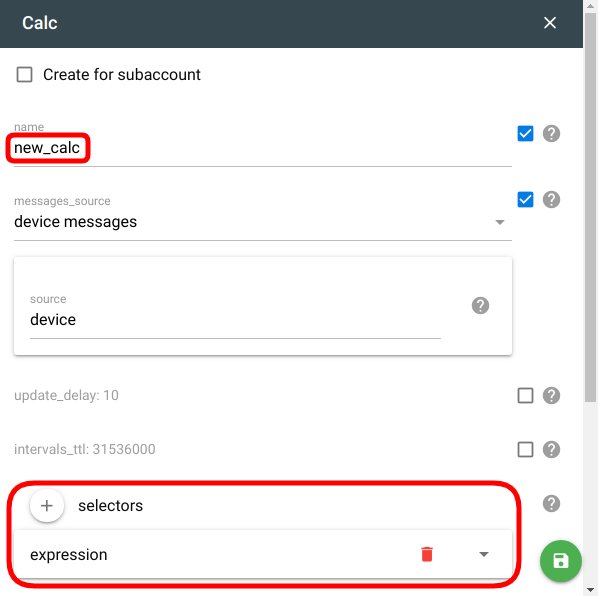
Create calculators that will perform intervals extraction and computation based on your logic and algorithms (flespi panel -> Telematics hub -> Calculators).

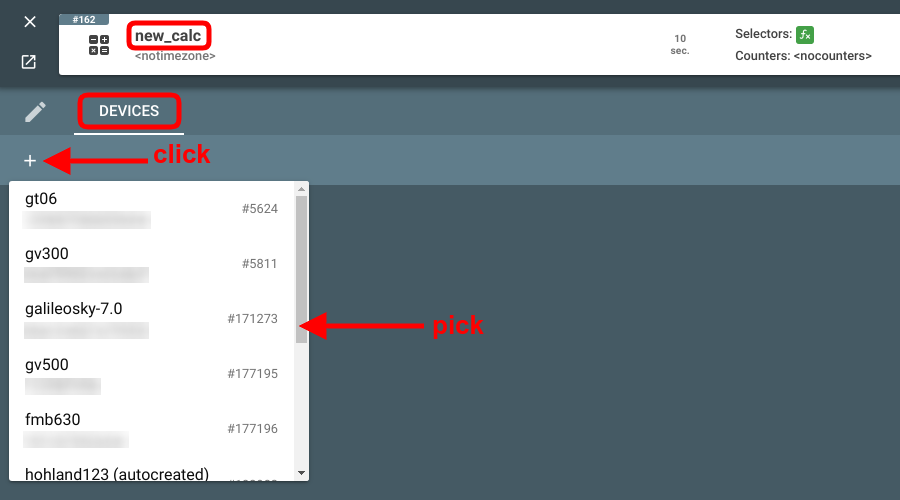
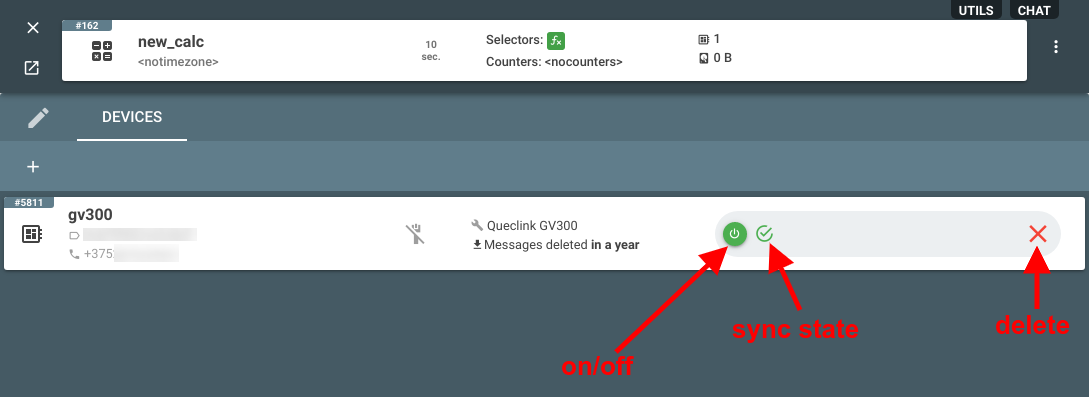
Assign devices to calculators.

Wait for assigned devices to sync state — this usually takes a few seconds.
Enjoy automatic calculation engine via API or any visualization tool described above.
***
Although the analytics engine is currently delivered in experimental mode, it proved to be quite stable. We keep adding new counters, functions that can be used in expressions, interval selectors and this summer will concentrate on bringing the API to its final look. We invite you to join the club of flespi users and start playing with automatic analytics as early as possible. I promise that once you try it, you will be impressed by the power and new possibilities it provides.
UPD: we prepared a series of posts with real-life cases of using flespi analytics. Check examples of detecting stops, geofencing, and aggregation by time.