This week we are back for another round of analytics exploration (see the previous rounds about trips and geofences). Today we’ll focus on splitting and calculating intervals for specific time frames. Such slicing may be convenient for putting together reports to analyze performance, dynamics, outliers, etc. over time.
Daily mileage & average speed
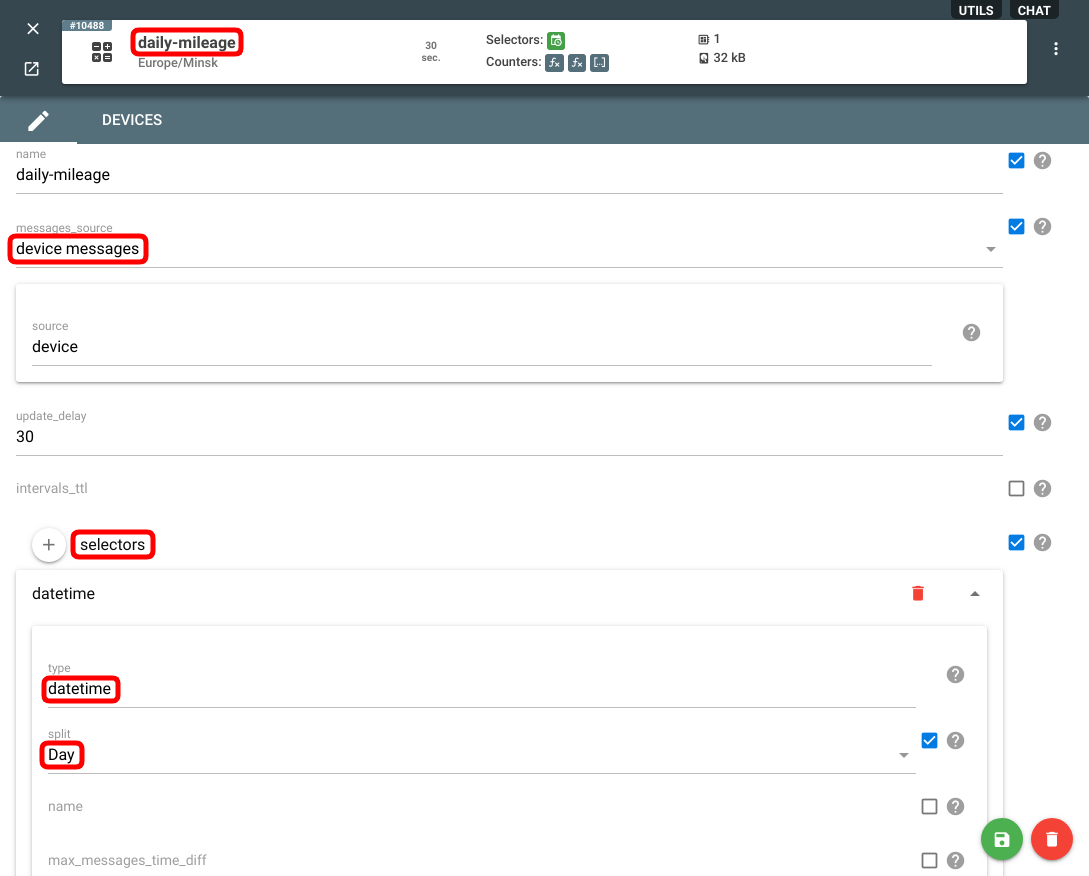
Let’s start with something basic — collect the daily stats of how many kilometers the vehicle travels every day and what it’s average speed is. We need a calculator relying on the messages from a device (in our case my WiaTag software tracker). Then we add a datetime selector and instruct it to split intervals by day:
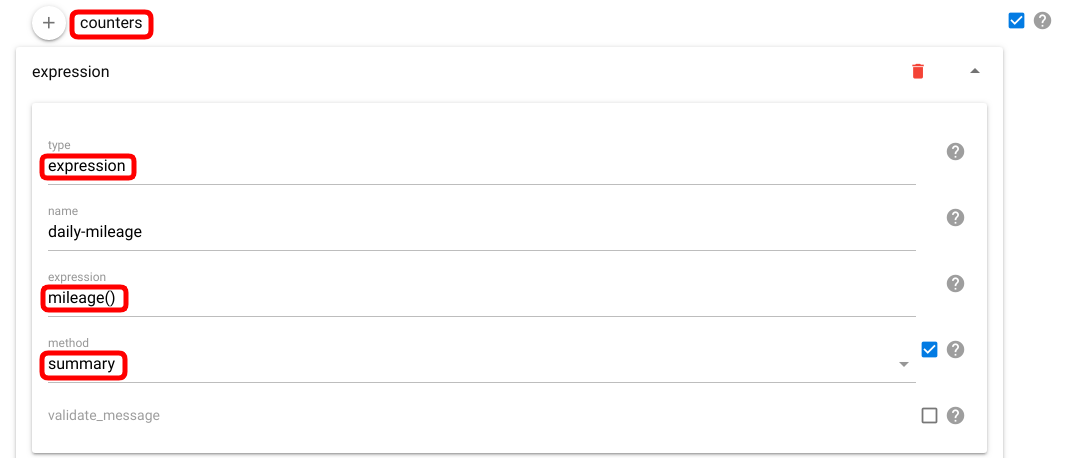
Since we want to know the distance traveled each day, we add a counter of an expression type, put “mileage()” into the expression field and pick the summary method to get an aggregate value:
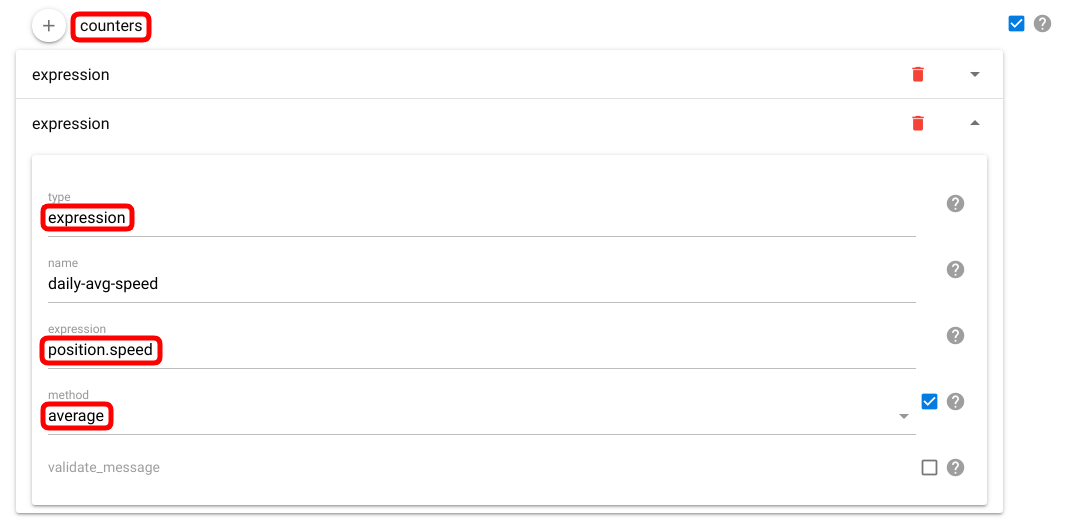
In addition, we’ll add the average speed for the day. For this one, we need an expression that will apply the average method to the “position.speed” expression:
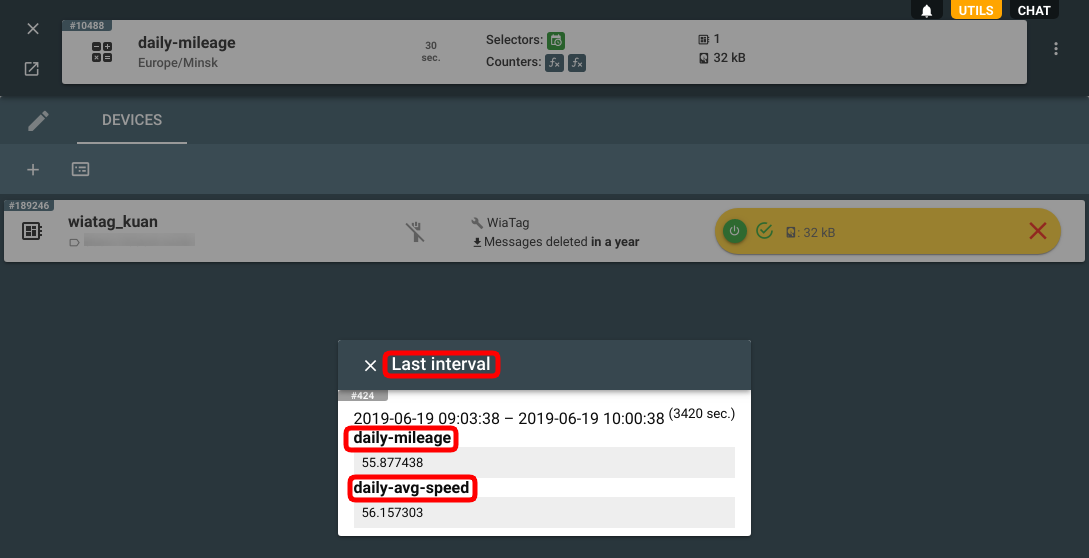
With the calculator setup complete, we assign the desired device to the calculator. Now if we click on the device card, we can see the last interval (just to make sure it works).
Time you get to work each day
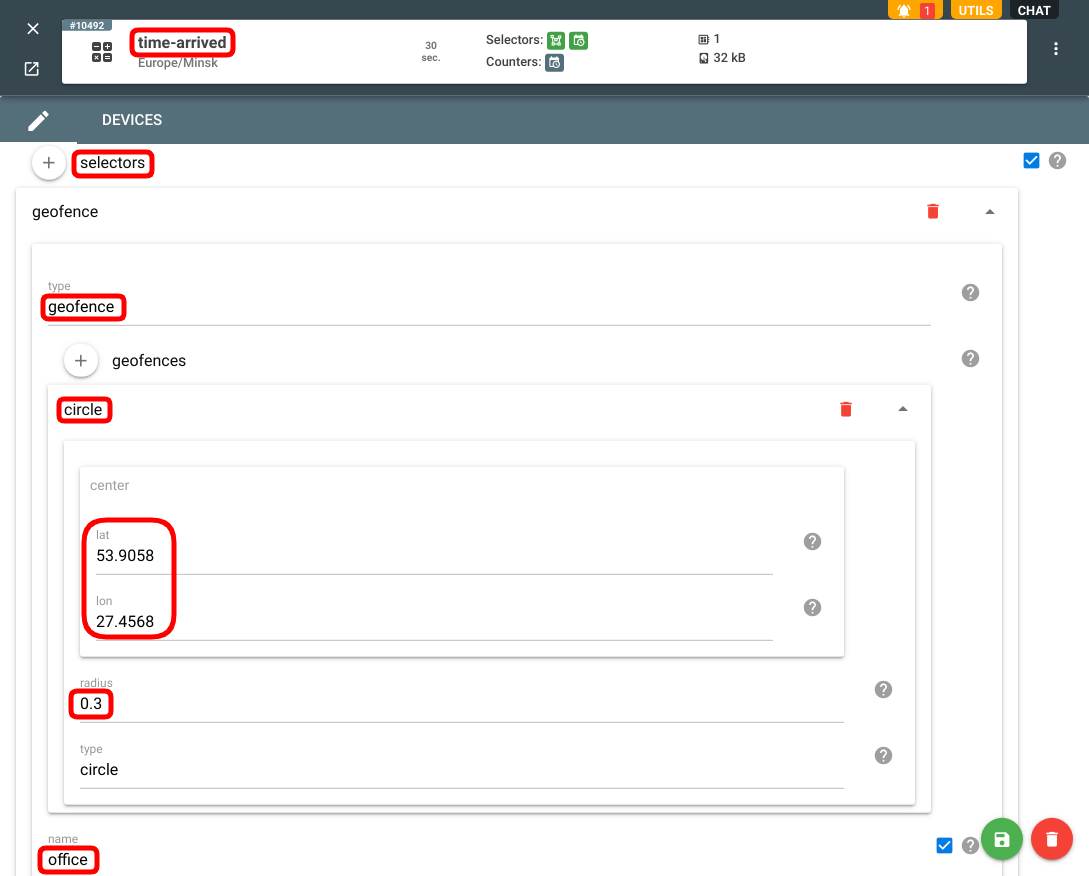
Another case we came up with looks at how to determine the time an employee comes to work (a vehicle enters the geofence).
What we need to do first is configure a geofence around the workplace. I usually park within 100-200 meters from the office building, so I specified the radius of 300 meters around the office to allow for some variation:
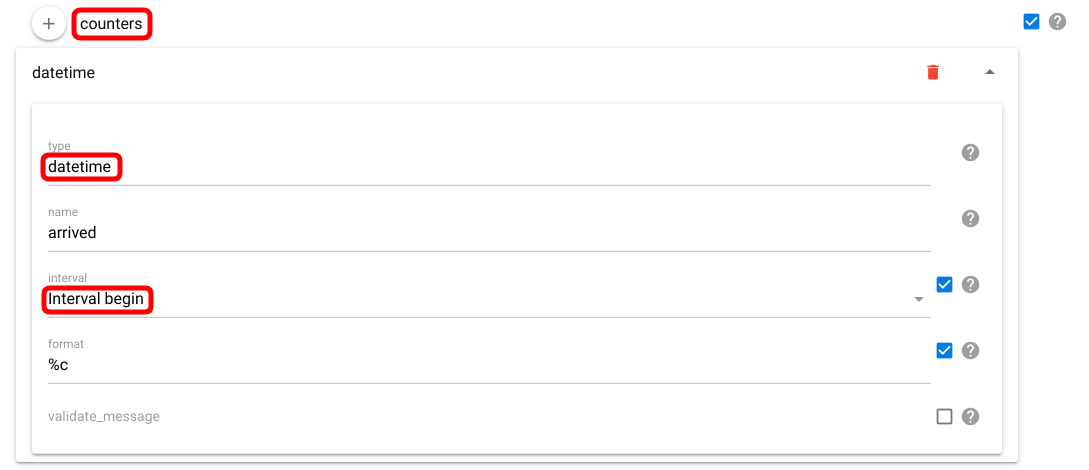
To get the daily values we created the same datetime selector as on the first pic above.
Now we want to detect the time of entering into the “office” geofence. For that, we need a datetime counter set up to catch the interval begin time:
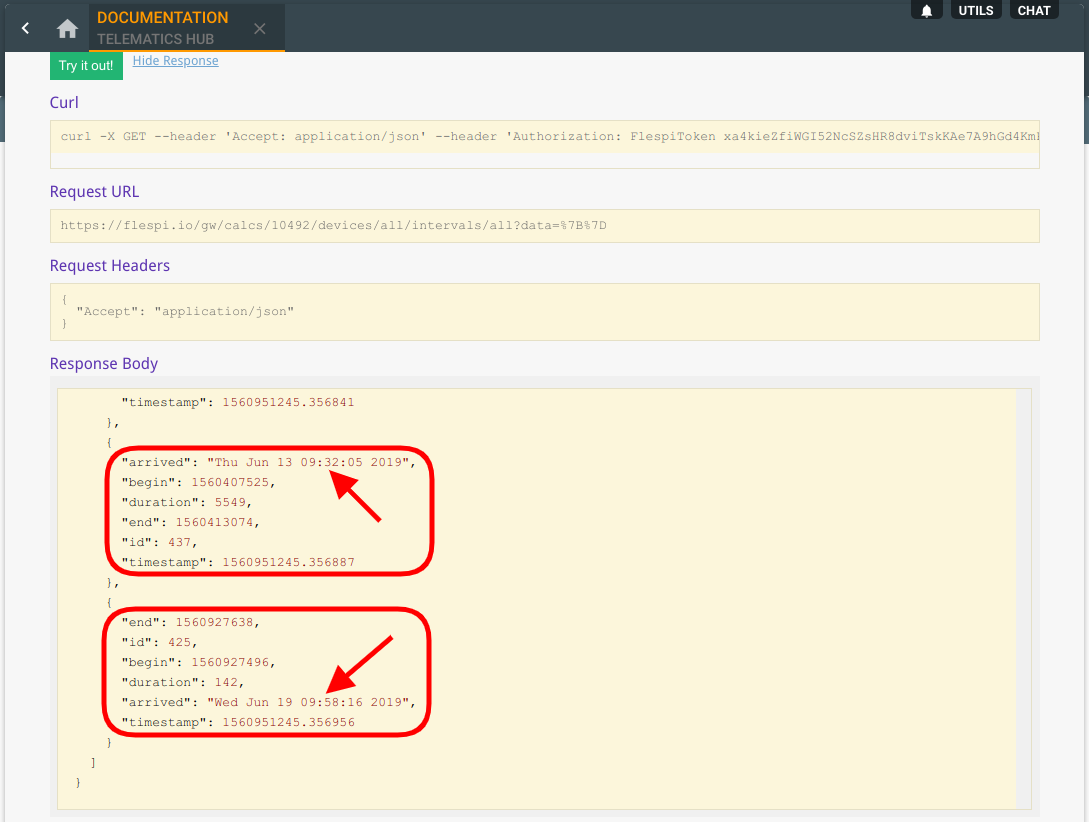
If we now make a GET calcs/{calcs.selector}/devices/{calc.devices.selector}/intervals/{calc.device.intervals.selector} request for this calculator in our interactive REST API docs, we will see a list of intervals with the arrival time and date determined for each item:
***
Being able to split the flow of device messages by time slots and calculate aggregate measures for these slots is one of the most frequent operations performed by fleet management platforms and monitoring solutions. Building reports, plotting stats, watching trends over time — flespi analytics offers a rich toolset to precalculate data for these tasks.