The core of our business is a high-performance high-availability telematics/IoT backend. However, sometimes our customers need just a little extra to get their task solved. And this extra usually concerns the visual aspect of a solution. This stimulated us to go the extra mile and create MQTT Tiles — an MQTT-based dashboarding tool.
MQTT Tiles started off as a simple tool but gradually evolved into a flexible and featureful platform for dashboard creation. And when the options are too many it may be difficult to match them against your project requirements.
In this article, we want to bring specific real-life projects into the spotlight to give you a better understanding of what can be achieved with the MQTT Tiles tool.
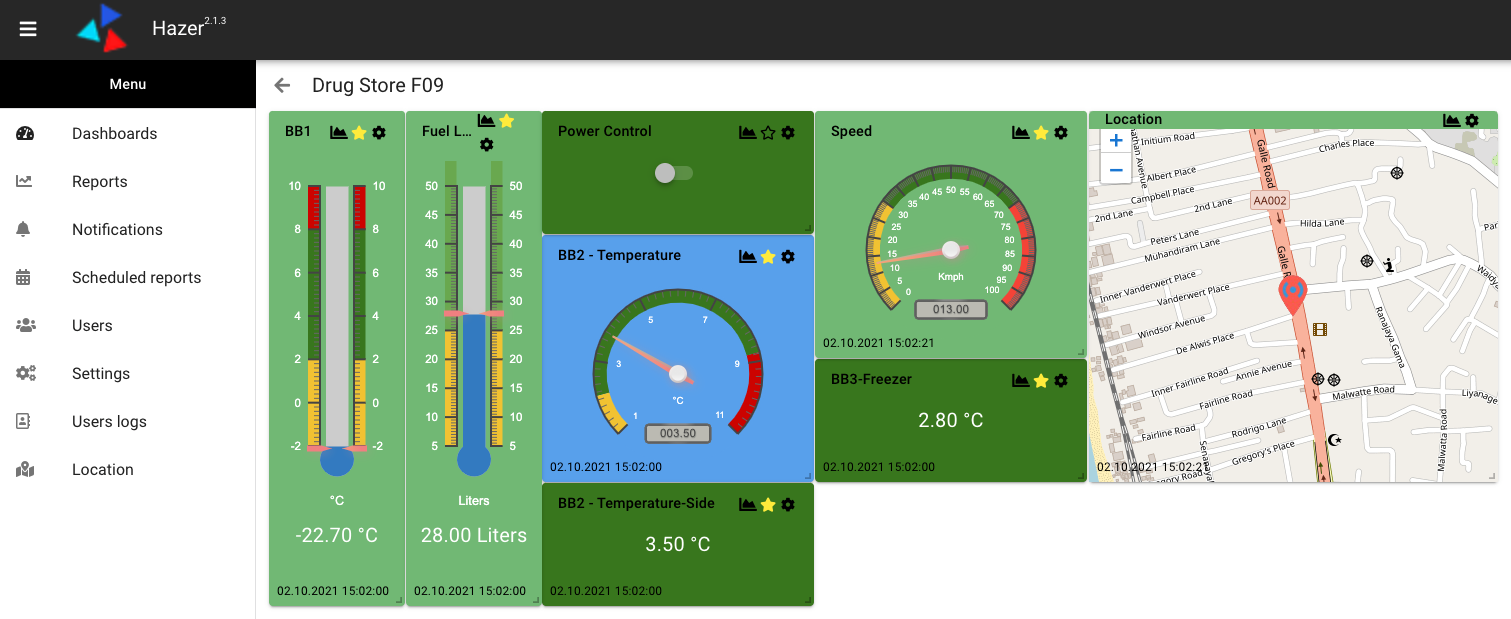
IoT case (Hazer app)
The Hazer app is probably the most comprehensive solution relying on MQTT Tiles. This IoT platform for sensor tracking allows creating vivid dashboards to monitor and control smart homes, healthcare, warehousing, building automation, utility services, parkings, whatnot.
Since MQTT Tiles is an open-source project, the KloudIP team was able to adapt it to their requirements with minimum efforts involved.
The project actively evolves and incorporates new functionality. The guys keep us updated on their progress in their comprehensive posts on the flespi forum.
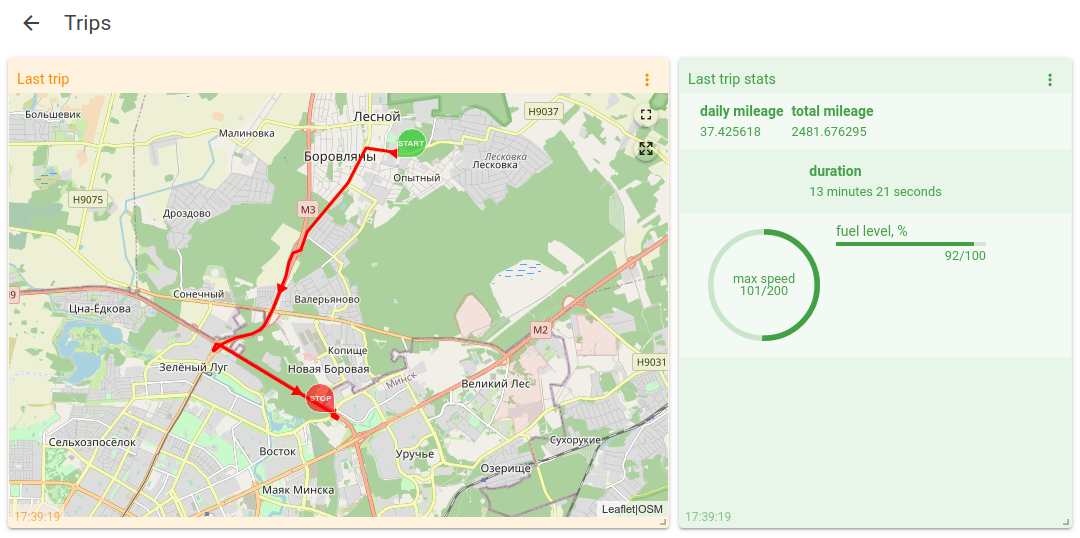
Fleet management
Even though we have a specialized dot-on-the-map tool in our ecosystem, in MQTT Tiles you can complement the map widget with other widgets to show additional information on a given unit.
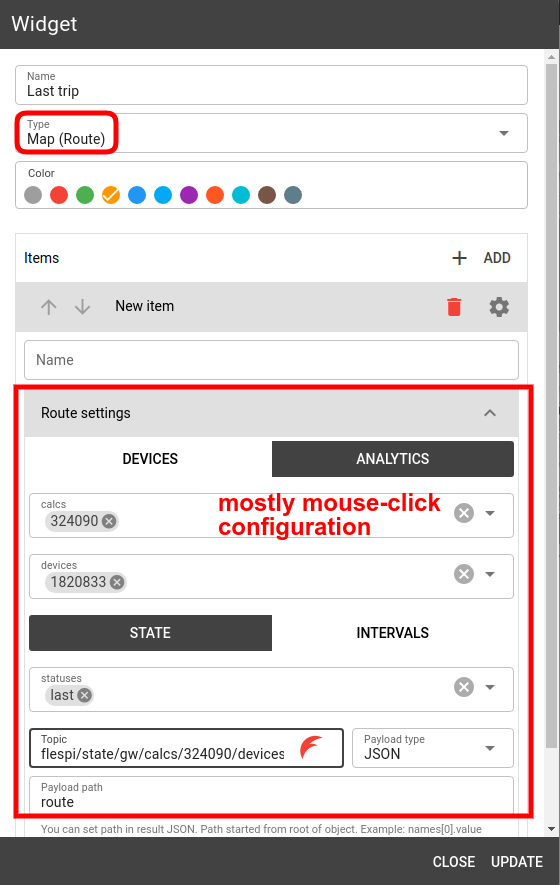
We’ve made it super-convenient to tie widgets to specific flespi devices or calculators, so the configuration is maximally quick and error-free:
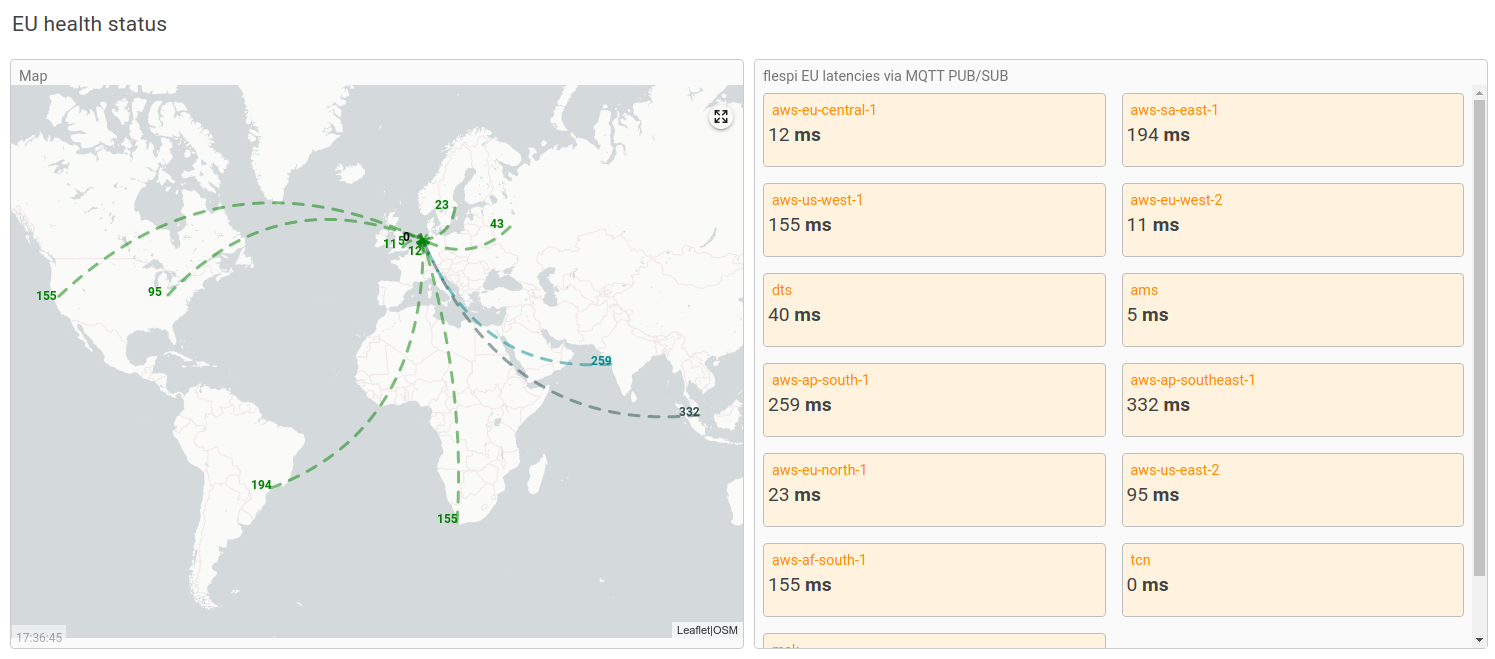
Infrastructure health monitoring
Complex projects with a lot of moving parts affecting the overall performance may benefit from a unified dashboard where statuses of all modules or building blocks are put together in a visually clear way — using scores, indicators, colored icons, etc.
As an example of what it could look like we will show a dashboard used within the Gurtam company (which flespi is a part of):
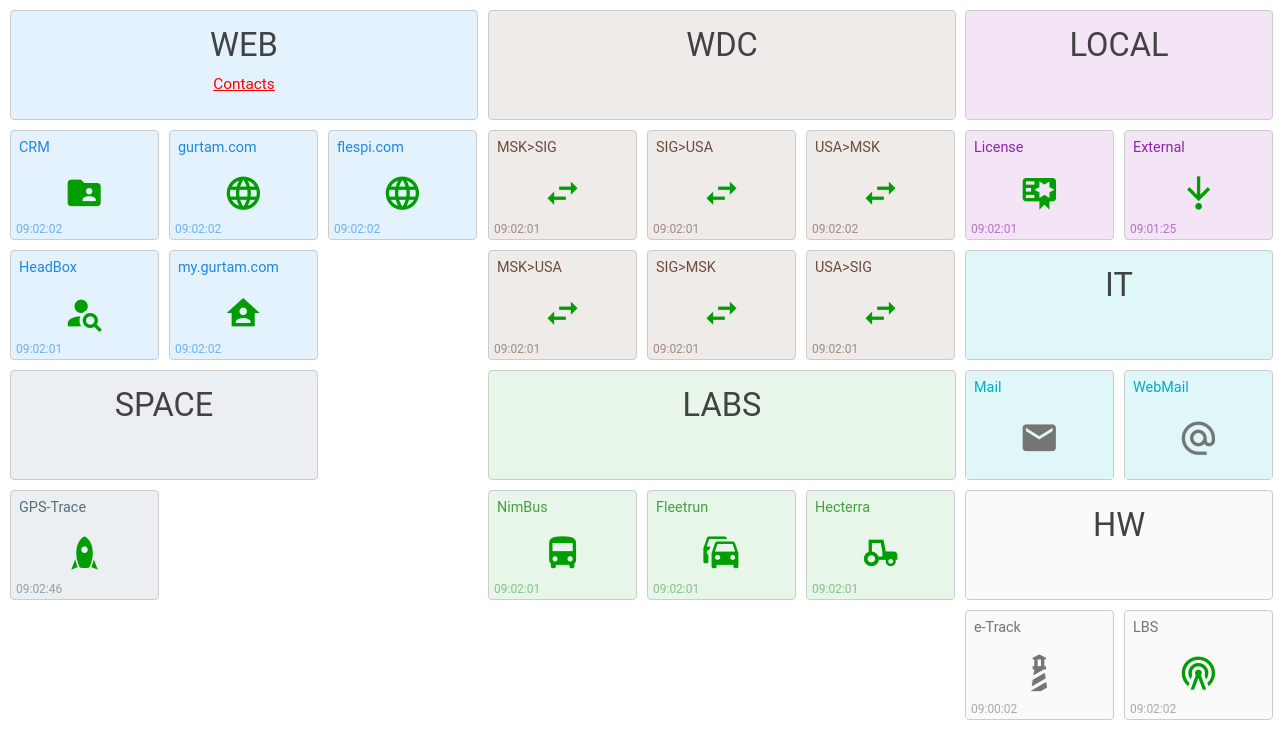
Such a dashboard is handy for support engineers who can see in real-time the availability of all company services and react to customer inquiries and complaints in an informative and well-grounded way.
To make such a dashboard operational each product team defines suitable indicators of normal and faulty behavior, comes up with the corresponding MQTT topics for each metric, and uses the MQTT client library of their liking to publish the updates to the broker for further reflection on the dashboard.
BTW, here’s the beta version of the flespi platform health page:
It also makes use of our MapView component for map visualization.
NEW: plan or layout visualization
Flespi is used not only in traditional GPS monitoring projects for tracking objects outdoors. It can also be used in versatile IoT applications to show the state of the key components on the static image background — e.g. it can be used for a floor plan, electric circuit, conceptual diagram, and more.
The recently introduced scheme widget allows to explicitly visualize the floor plan (or another layout) and add the key elements to it. Then you can add other widgets (label, text, toggle, indicator) in the specific positions on the image to reproduce a specific plan or diagram.
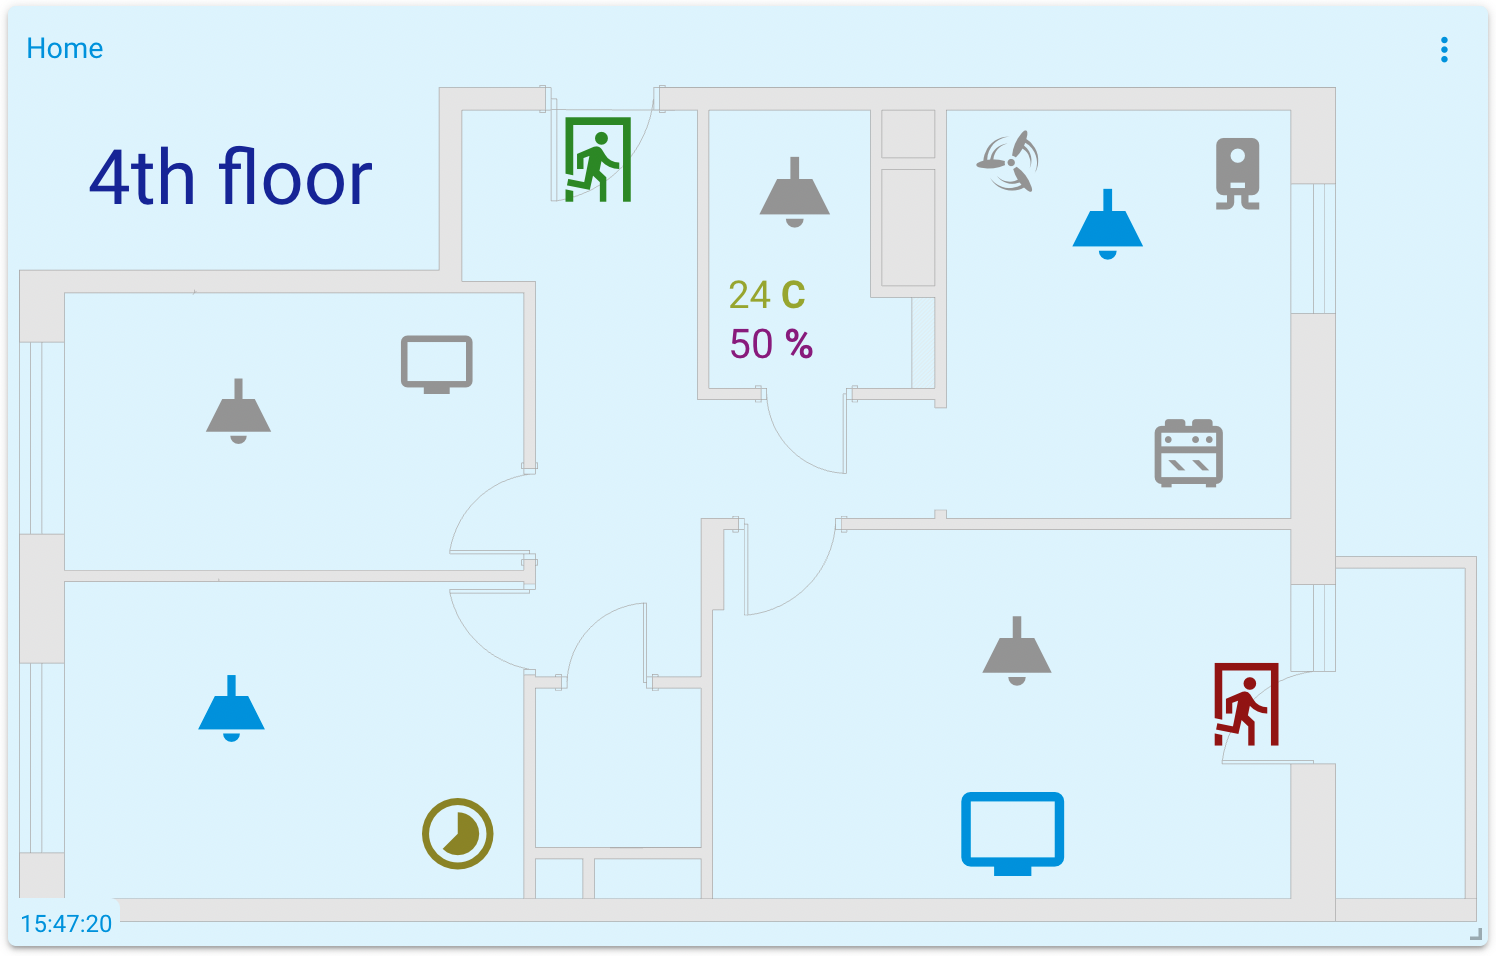
Apply certain logic to make these widgets reflect the current state of the object — e.g. when the alarm went off, when the person left the building, etc.
Your fresh idea
These are just some of the examples that we know about or that we implemented ourselves. However, the principles of MQTT-based communication apply to any project that wants to take advantage of its responsiveness, reliability, and other features pertinent to the MQTT protocol.
***
As you can see, the scope of projects that can be visualized using MQTT Tiles is really wide — once the data comes to the MQTT broker, you subscribe to the appropriate topics, pick the specific values, and find the suitable widgets to depict them.
In case you decided to try out with some test project, here are the resources to help you get it right.
With any questions and suggestions contact us in Helpbox.