Say you have some devices connected to the flespi telematics hub that send messages with a set of parameters. You use TrackIt to see the device location. But what if you need to analyze device parameters — see the dynamics, compare the same parameter for different devices or compare different parameters for the same device? Grafana is a flexible and functional open-source tool for numeric data visualization. The central task here is to connect flespi with Grafana.
To solve this task we developed the flespi devices grafana data source plugin that can fetch flespi devices data and visualize their parameters on grafana dashboards.
Disclaimer. For more fresh grafana versions e.g. 10+ take a look at new datasource plugin developed by flespi.
Plugin installation
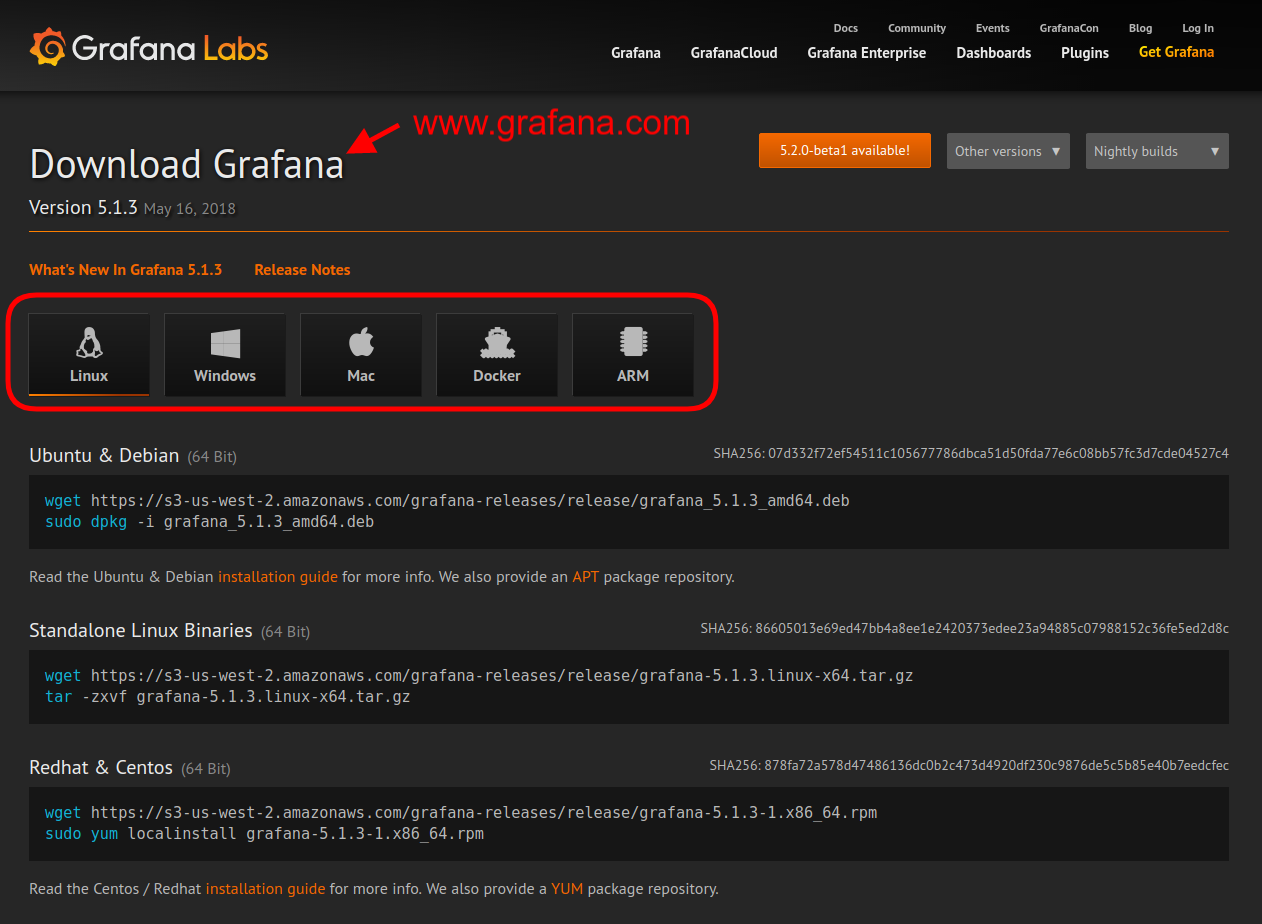
Prerequisite: installed Grafana (v. 5.1 or higher). Note: the plugin currently does not support Grafana v7.
To install flespi-devices-datasource plugin for Grafana, execute the following commands:
sudo grafana-cli --pluginUrl https://github.com/flespi-software/flespi-devices-grafana-datasource/archive/master.zip plugins install flespi-devices-datasource
and then
sudo service grafana-server restart
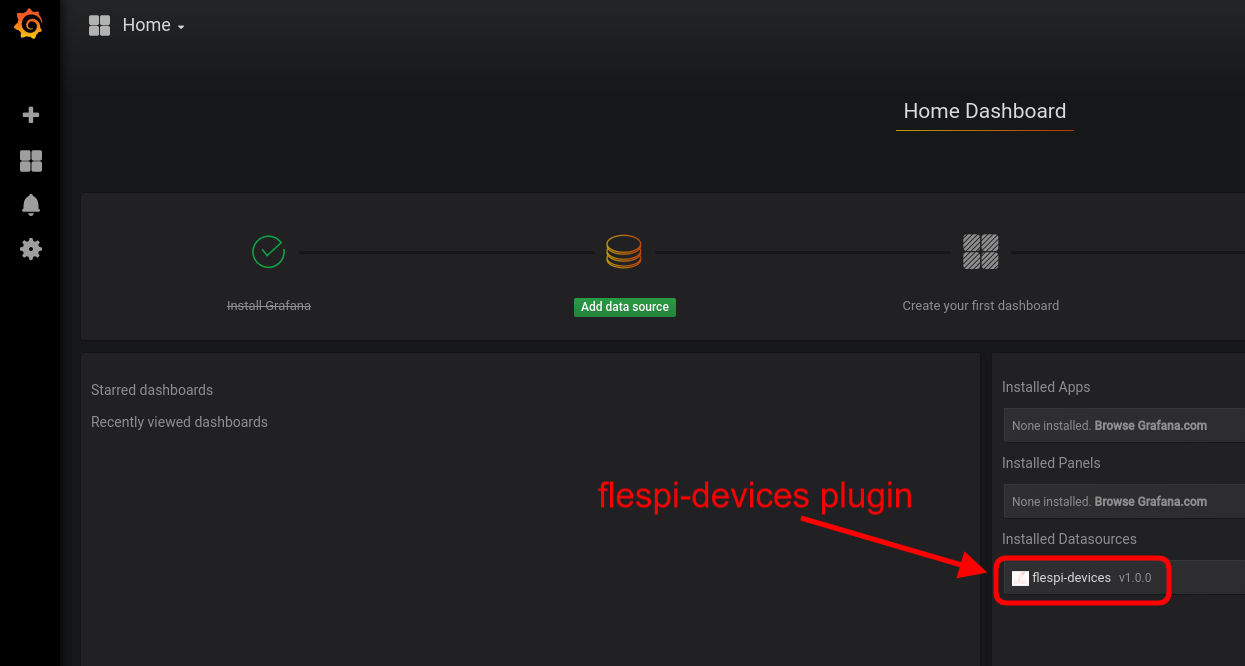
After these two commands, you should see the ‘flespi-devices’ plugin in the ‘Installed Data sources’ section of the Grafana Home Dashboard.
Datasource setup
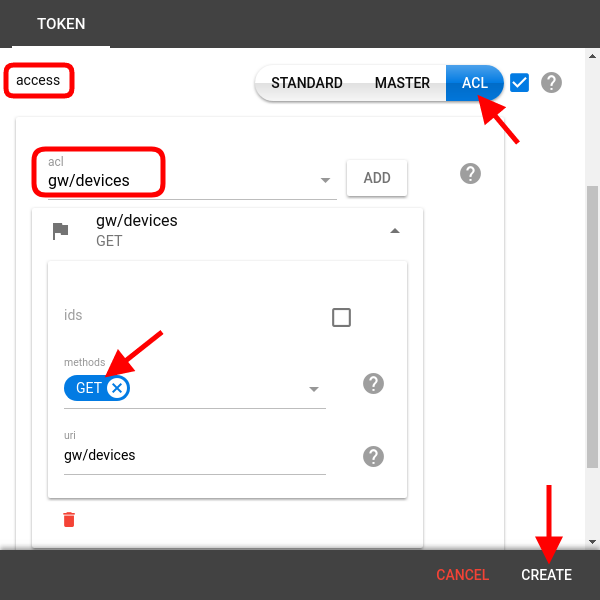
Since the data source creation process will ask you for a flespi token at some point, let’s create it first. It makes sense to create a separate flespi token for grafana instance with maximum TTL and limited ACL capable of performing only /gw/devices GET-requests:
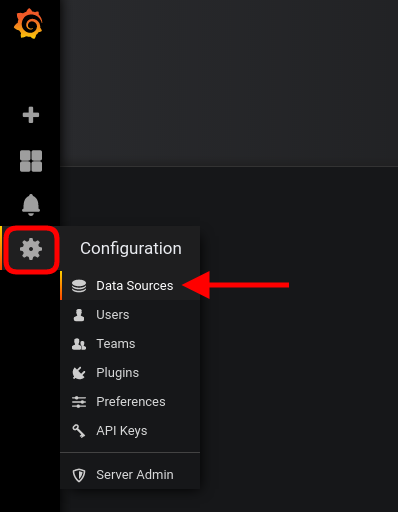
Now we are ready to create a datasource. Open Configuration (Сogwheel) -> Data Sources and hit the ‘Add data source’ button.
Enter the plugin name and select ‘flespi-devices’ in the Type drop-down. Then enter flespi URL (https://flespi.io) and insert flespi token in the corresponding form fields.
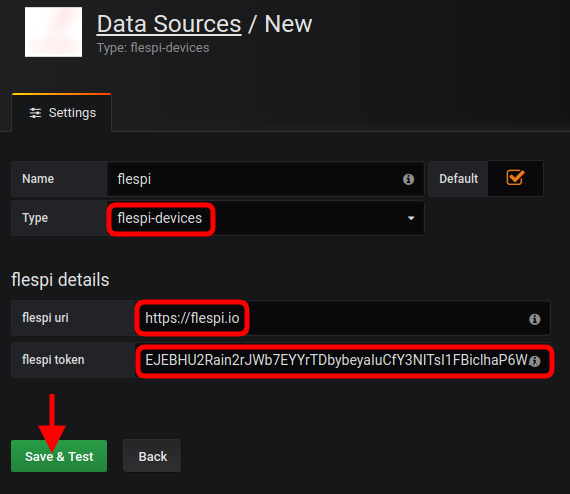
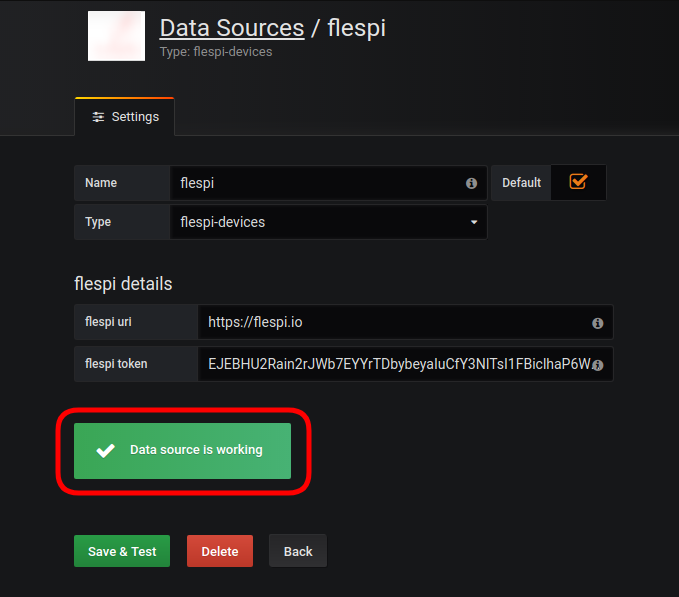
Hit ‘Save & Test’ button to create the datasource. A green pop-up saying ‘Data source is working’ will indicate that the datasource is operating correctly:
Dashboard setup
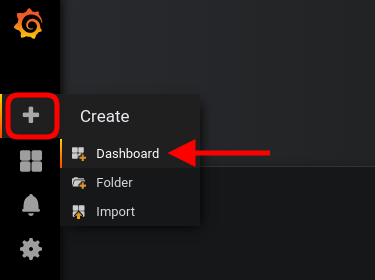
The next step is to create a dashboard. Click Create (‘+’ sign) -> Dashboard and choose Graph.
To create dashboard dynamically populated with devices that you create in the flespi panel we will use templating variables.
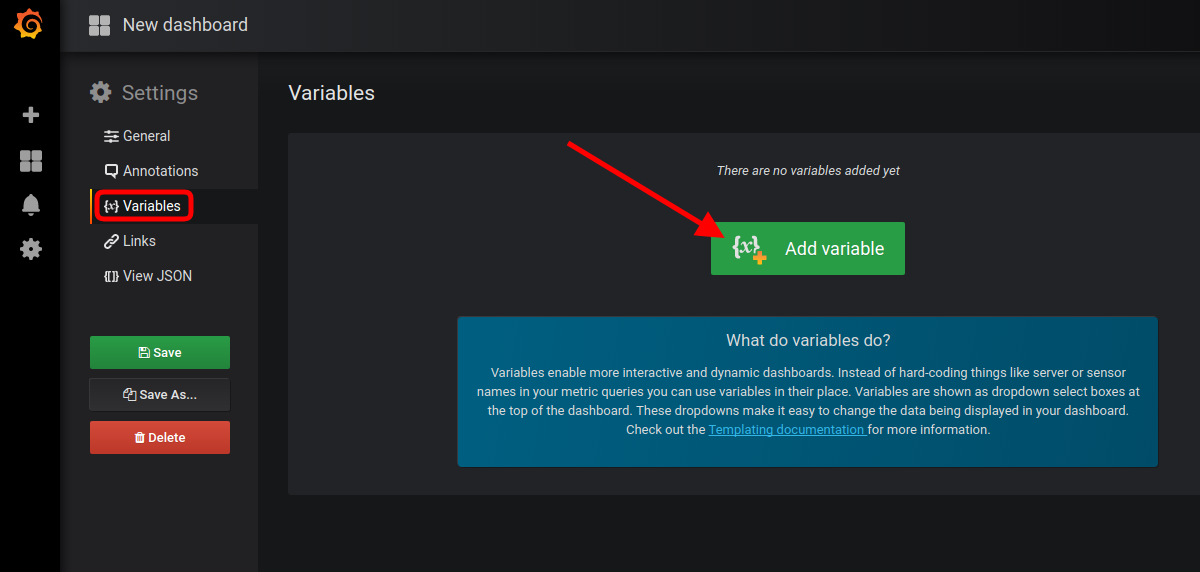
Adding variables
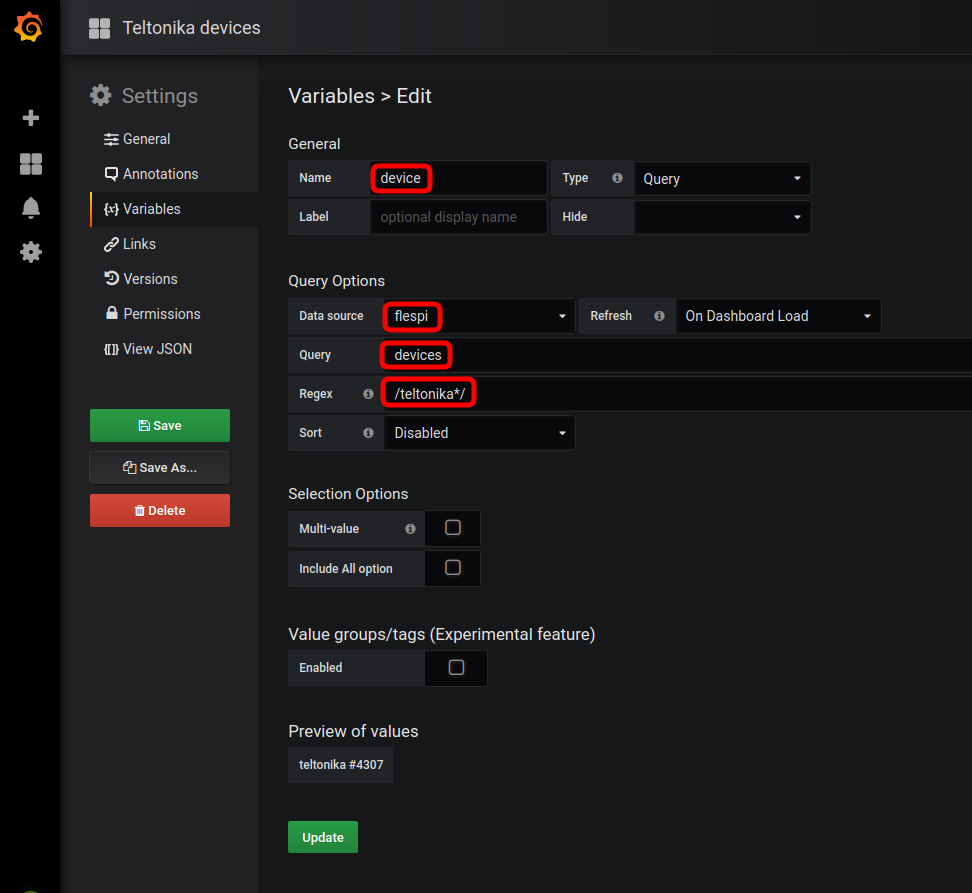
To add variables to the dashboard hit the cogwheel in the top right corner and choose Variables tab. Hit ‘Add variable’ button.
Name: device (can be anything else)
Data source: flespi (or another name you gave to the data source)
Query: devices
Include All option: on, custom All Value: all (recommended)
Regex [optional]: if you want to display only certain devices on this dashboard; for example, type /teltonika*/ in the regex field to show only devices, which name starts with Teltonika prefix
Hit Add
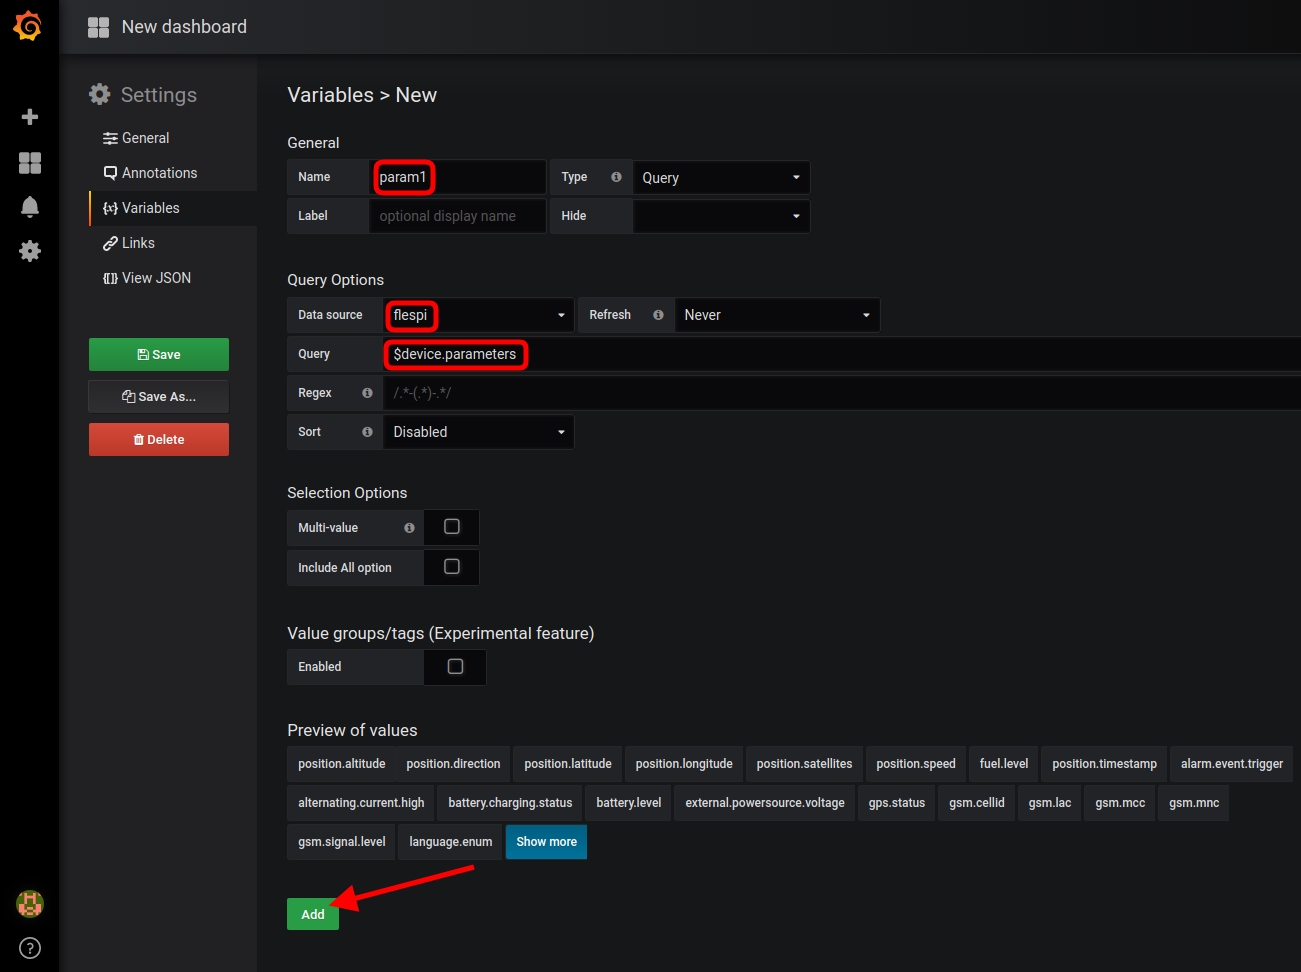
Add another variable for parameters:
Name: param1 (can be anything else)
Data source: flespi
Query: $device.parameters or parameters ('$device.parameters' will show only parameters of selected devices; 'parameters' will show all parameters of all devices of this account)
Multi-value [optional]: you can turn it on
Include All [optional]: you can turn it on
Hit Add
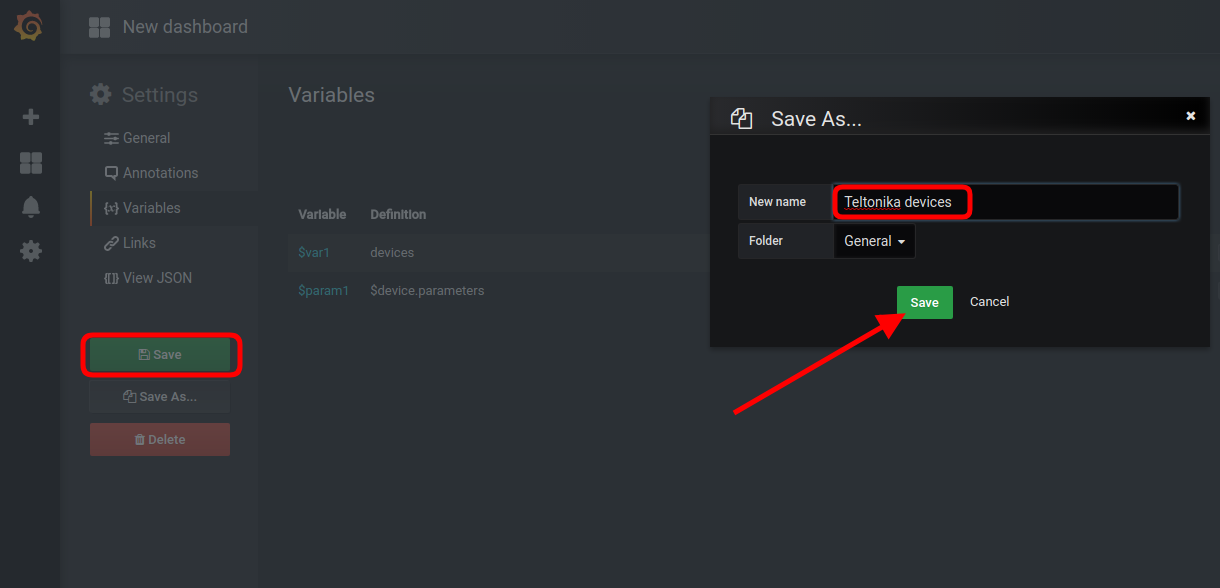
Save the dashboard (green button on the left) and give it a name (e.g. “Teltonika Devices”).
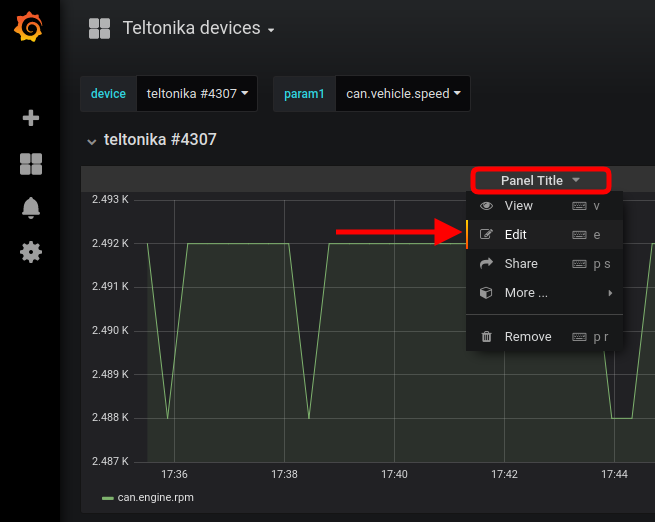
Graph setup
Hit ‘Panel Title’ -> Edit to open the query editor form:
Switch Data Source to flespi.
In the ‘select device’ field type $device ($ + the name of a variable from the previous step), hit Enter. This will take the device for the graph from the ‘device’ drop-down in the left upper corner of the dashboard.
Same for parameter: instead of ‘select parameter’ type $parameter, hit Enter
Generalization function may be left blank. Generalization function is a method parameter in the request, e.g. average, max or min. If not chosen, no generalization of parameter values is performed.
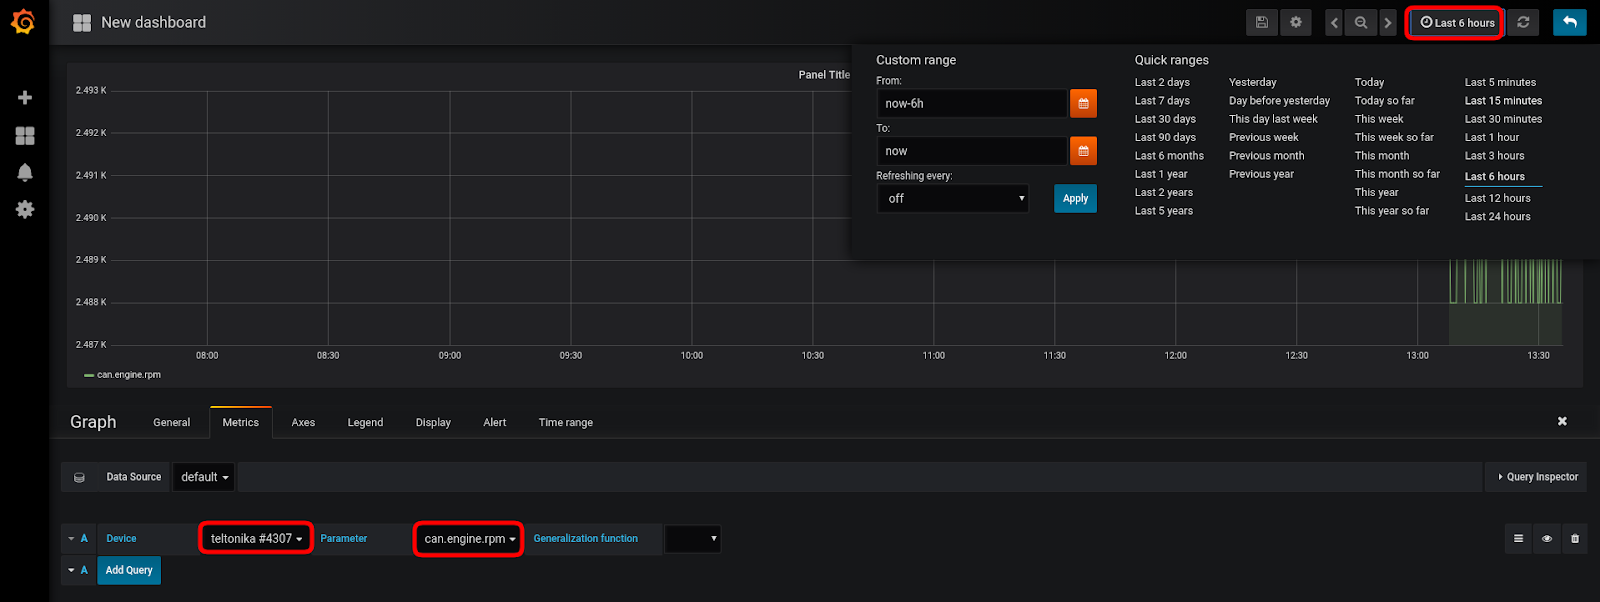
For a more detailed graph you may want to change the period in the top-right corner of the dashboard, e.g. to “last 15 minutes”:
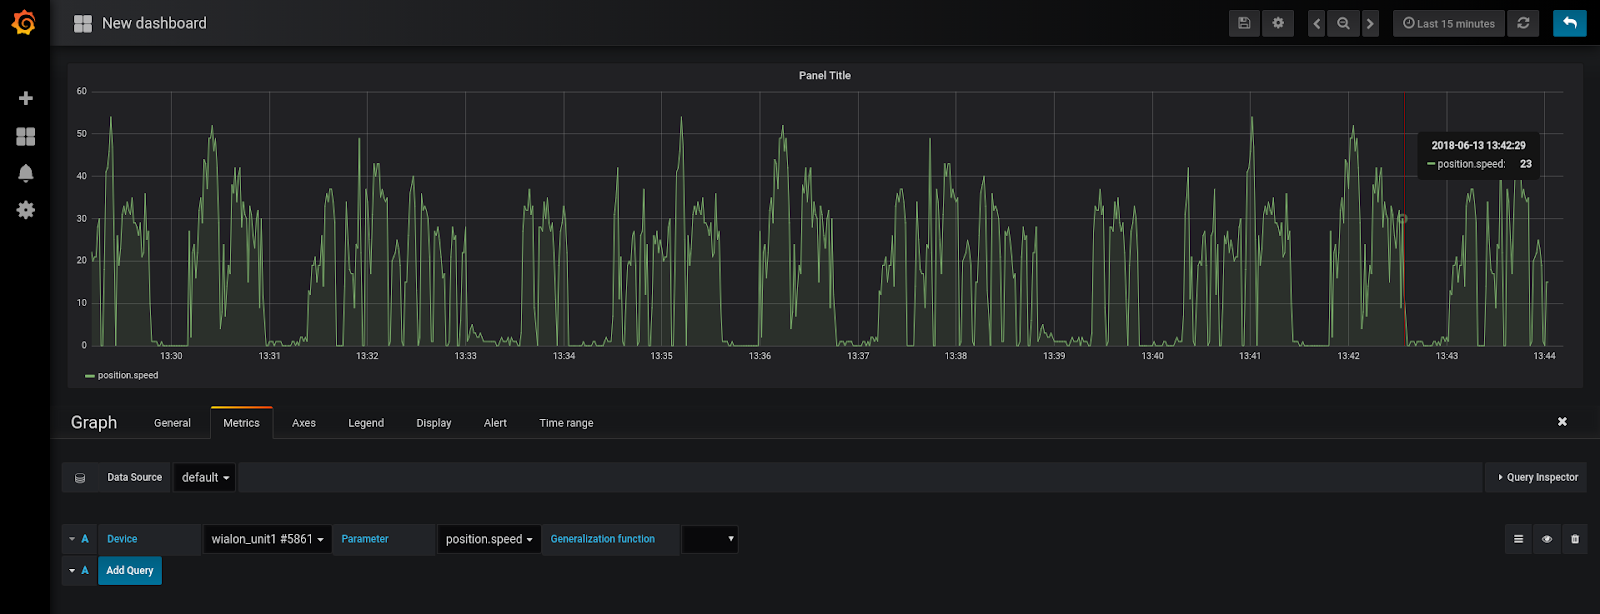
Change the device and the parameter in corresponding drop-downs and the graph will automatically update:
Dynamic row creation
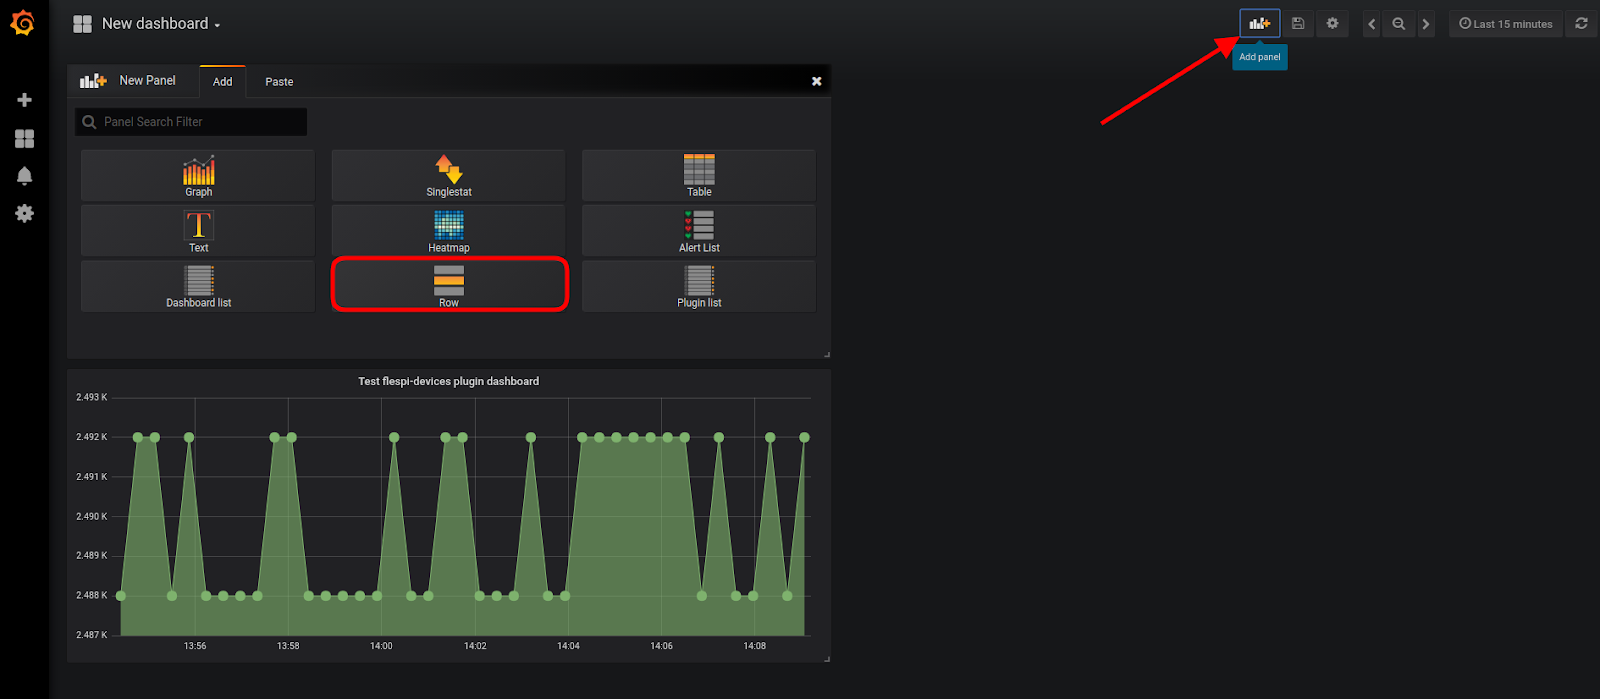
Click ‘Add panel’ button (leftmost button at the top of dashboard), then click ‘Row’ tile.
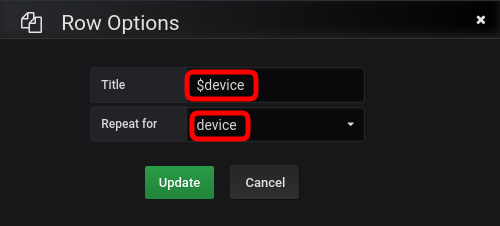
The graph will be encapsulated into the row. Open row settings (cogwheel near the row title) and enter
Title: $device
Repeat for: device
Hit Update.
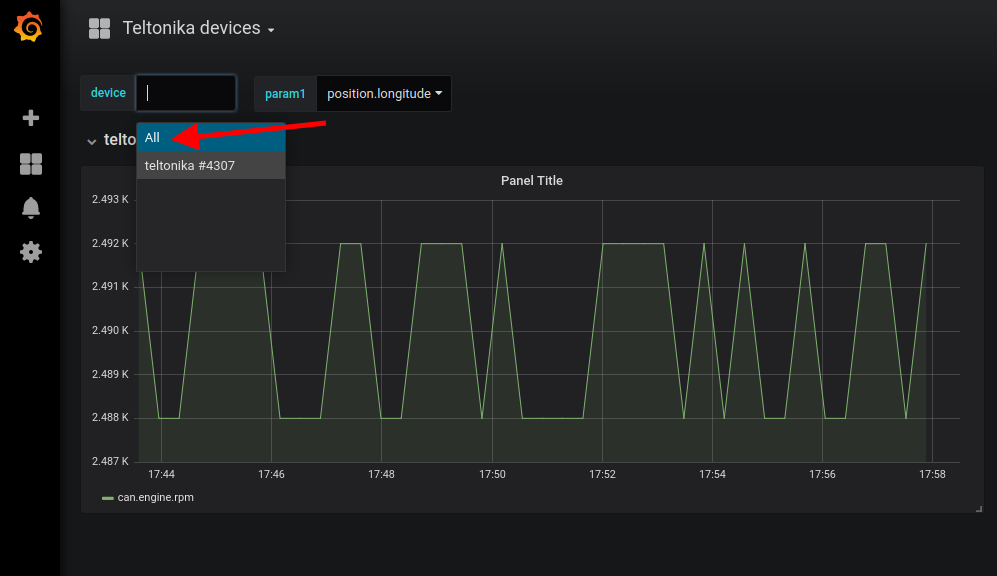
Save the dashboard and select ‘All’ in the devices drop-down. There will be a separate row with the graph of selected parameter for each device:
You can select multiple parameters to display them on each graph. Or use wildcards in parameter names, e.g. can.* to display all numeric CAN parameters or *.voltage to display all voltage values.
Similarly, you can build a dashboard that shows all parameters for selected devices on separate graphs. With the power of Grafana, you can build dashboards that best fit your needs. And if you think that current implementation of flespi-devices-plugin lacks important features, feel free to fork it on GitHub, implement new features, and send us your pull requests.
Bonus
As usual, flespi comes with extra good news!
You don’t have to set up the dashboard yourself: we set up a dashboard for you and made it available to download here. All you need is set up a data source, import our dashboard, tune it according to your needs, and enjoy the results.