- Essentials
- Initial installation
- Devices' parameters visualization
- Accounts statistics visualization
- Logs visualization
- Changelog
Essentials
Grafana is an open-source application for interactive data visualization, offering various charts, graphs, and visualization tools for data regardless of the location it's stored.
Data is channeled into Grafana through supported data sources. To enable visualization of your flespi data in Grafana, we've developed the ‘flespi-parameters-datasource’ open-source plugin. You can download and install it on your Grafana server, configure access to your flespi account as a data source, and create diverse dashboards to visualize your flespi data.
How to install plugin and configure data source
To install the plugin on your Grafana server, follow the instructions provided in the plugin's README file.
Once the plugin is installed, it will appear in the list of available plugins within the Plugins catalog at Administration > Plugins. To find the plugin easily, type 'flespi':
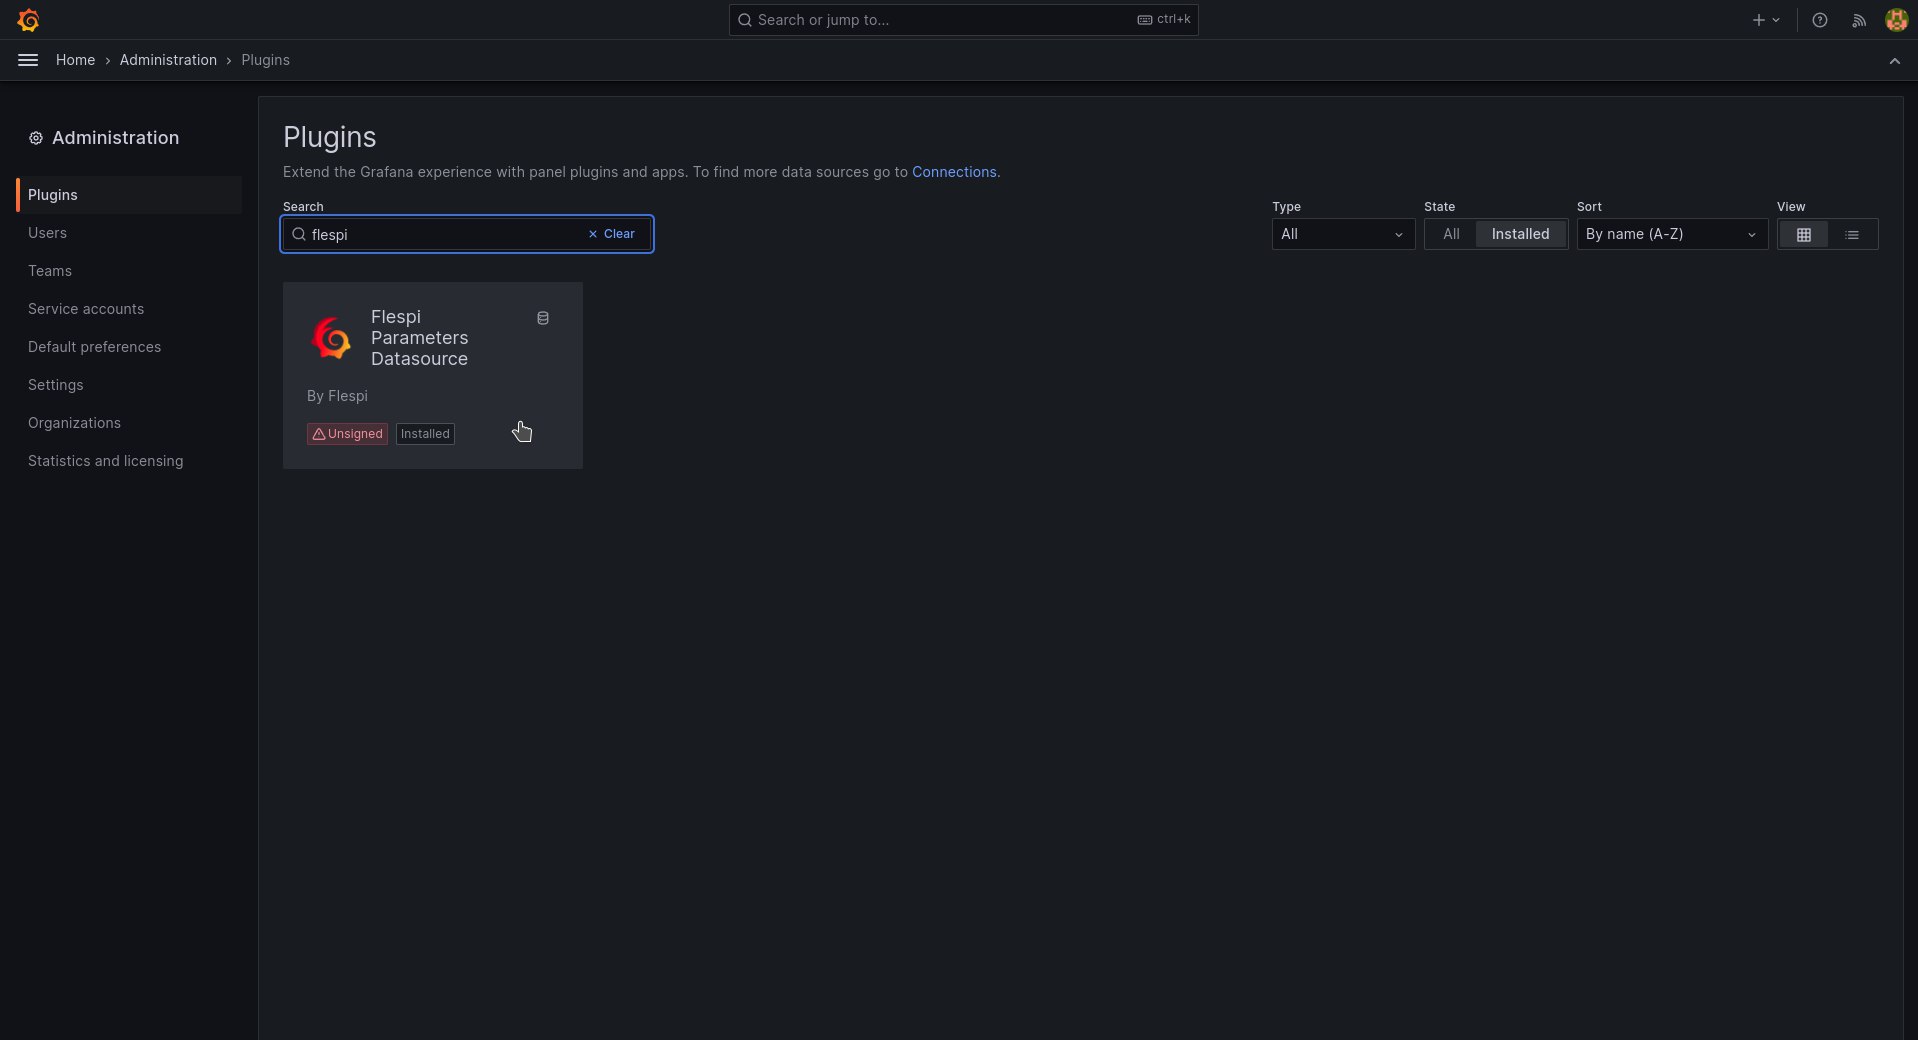
Select the Flespi Parameters Datasource plugin and click the 'Add new data source' button to create the flespi data source:
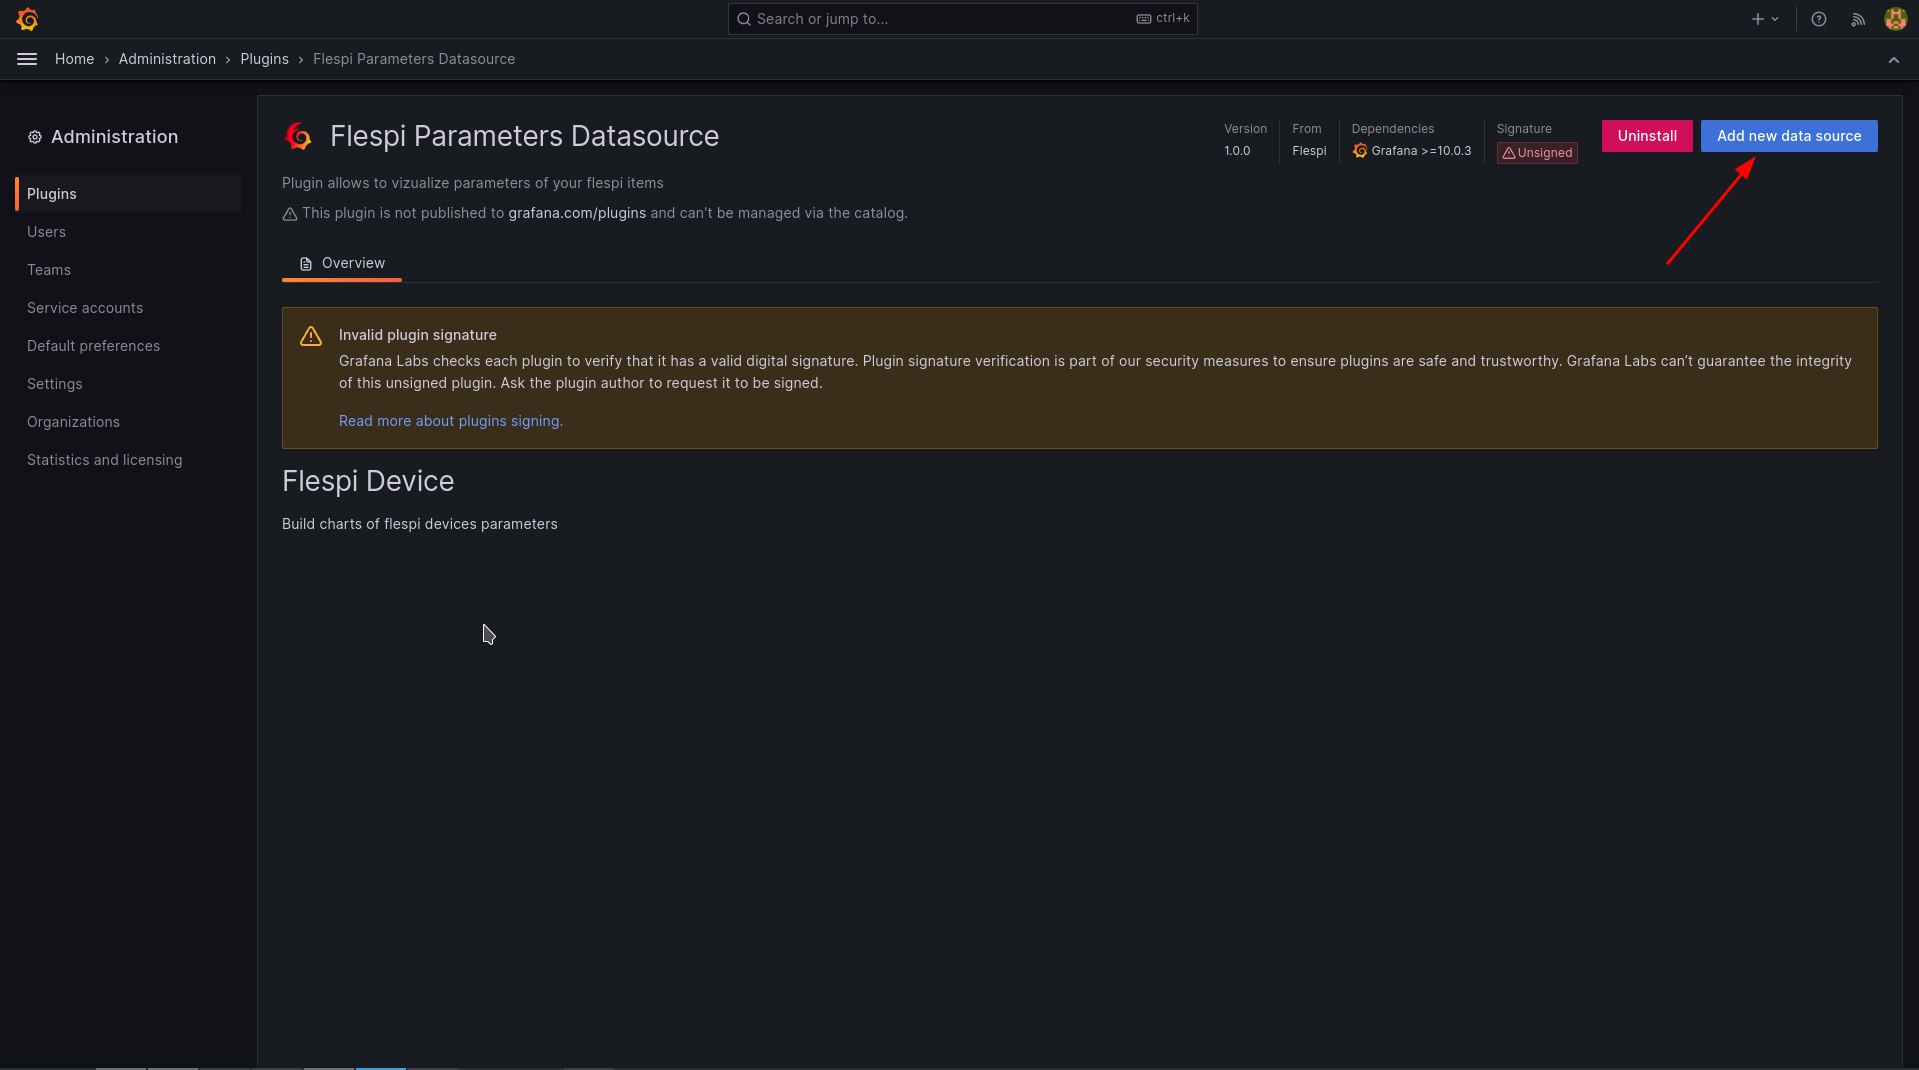
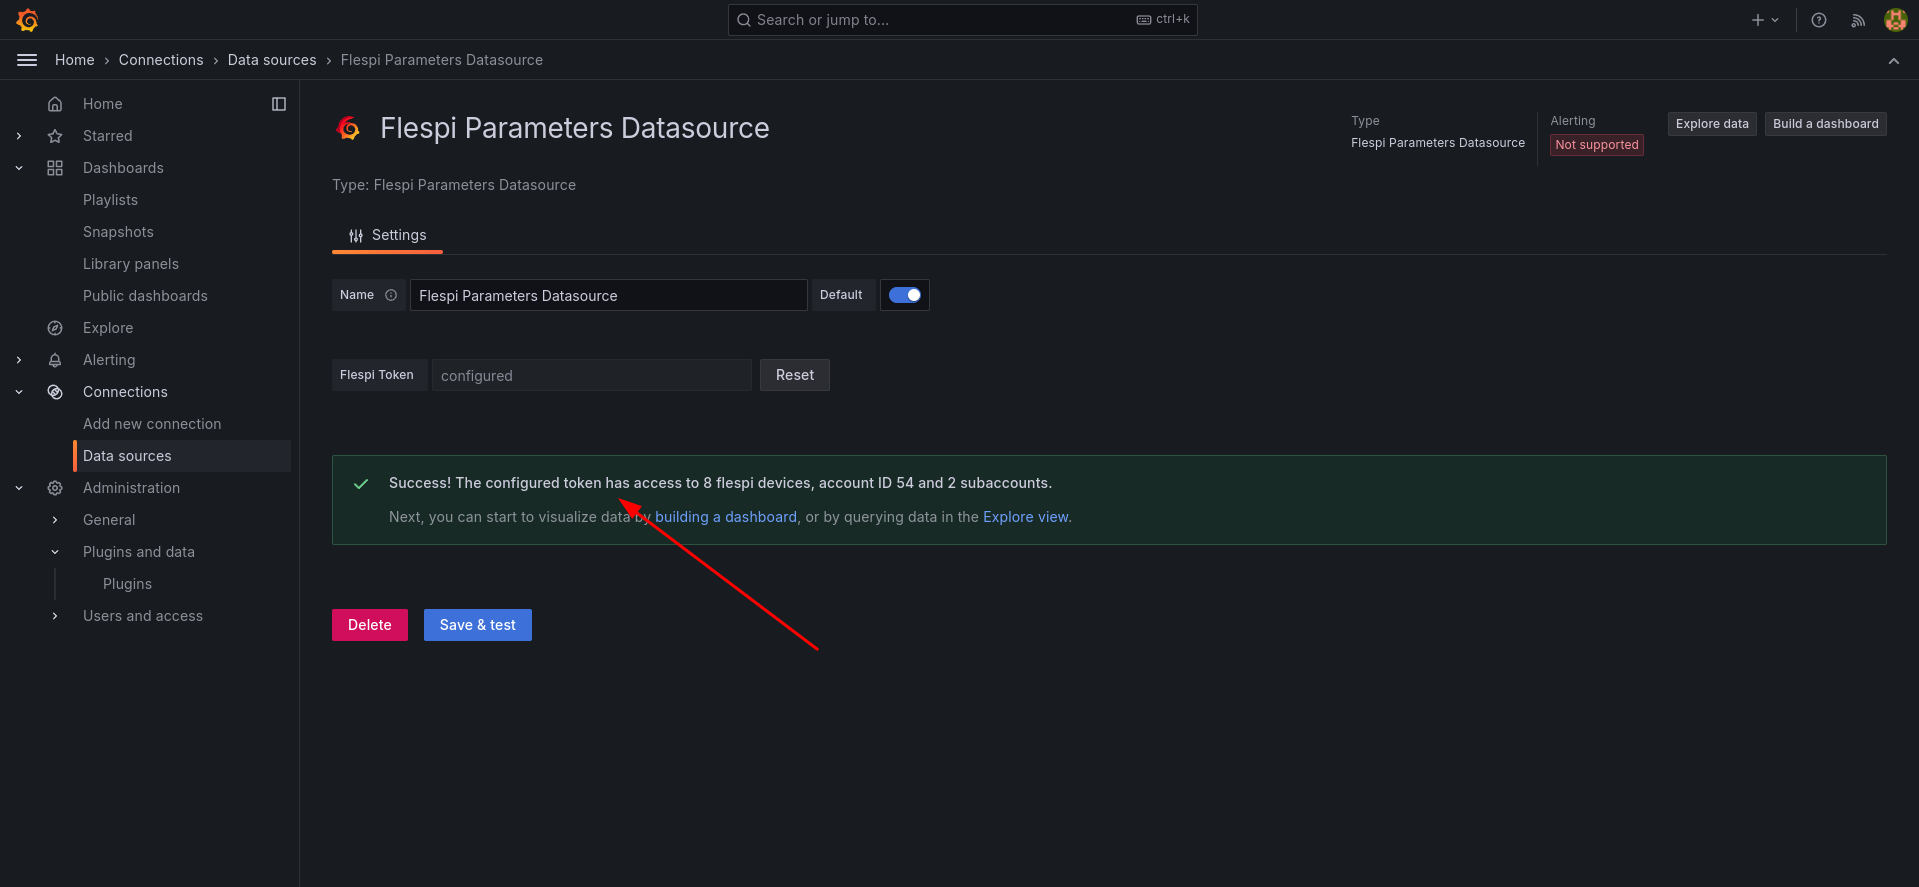
The Settings window of the data source will open. Here, you need to configure the Flespi Token that the data source will use to access your flespi data.
Paste the token into the corresponding field and click the 'Save & Test' button to verify access:
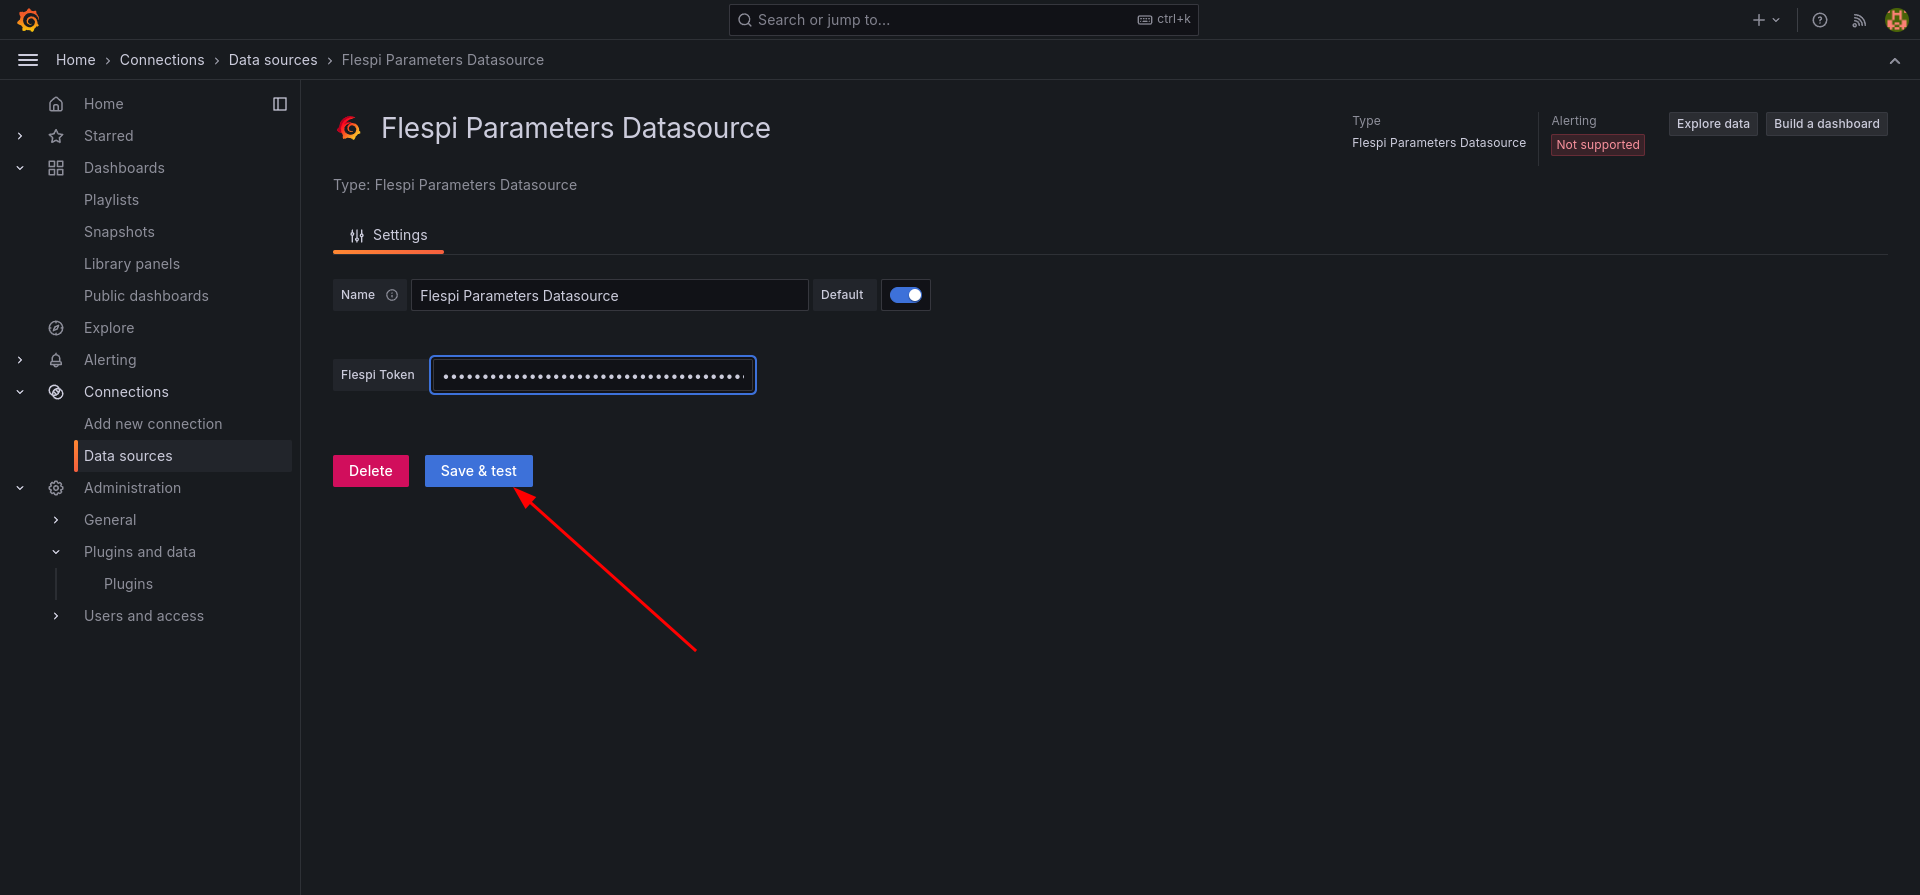
If the data source is configured correctly, a "Success!.." banner will display, showing what flespi instances are available for the given token:
How to build a simple dashboard
Once the data source is configured, you can build a dashboard. Let's start with a simple one displaying a graph of a specific parameter from a flespi device.
Click the 'Build a dashboard' button (located in the top right corner), then 'Add visualization,' and select Flespi Parameters Datasource as the data source for the new dashboard:
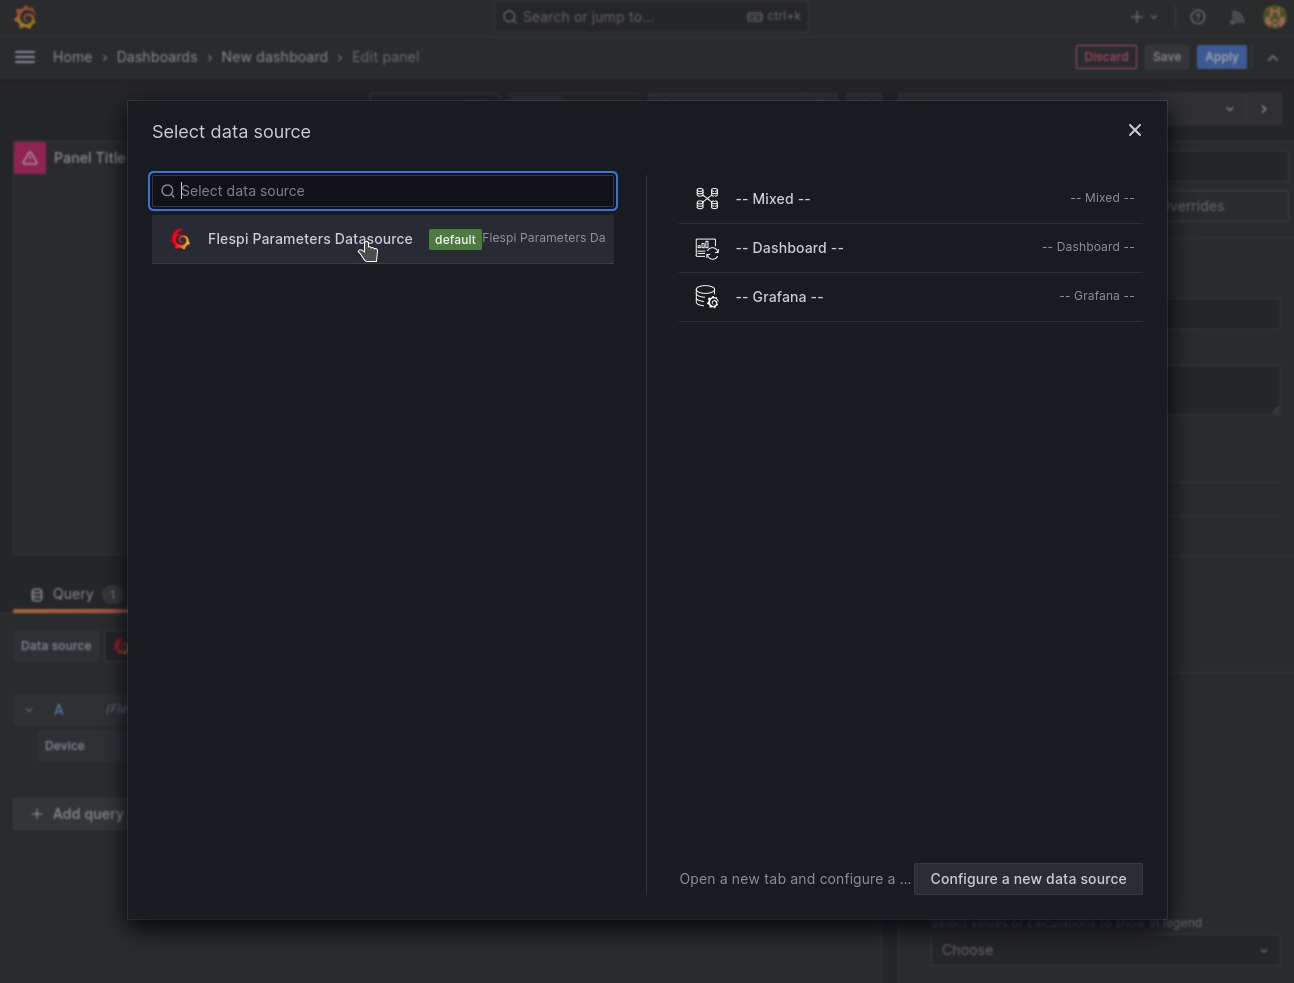
The Query Editor window of the dashboard will open.
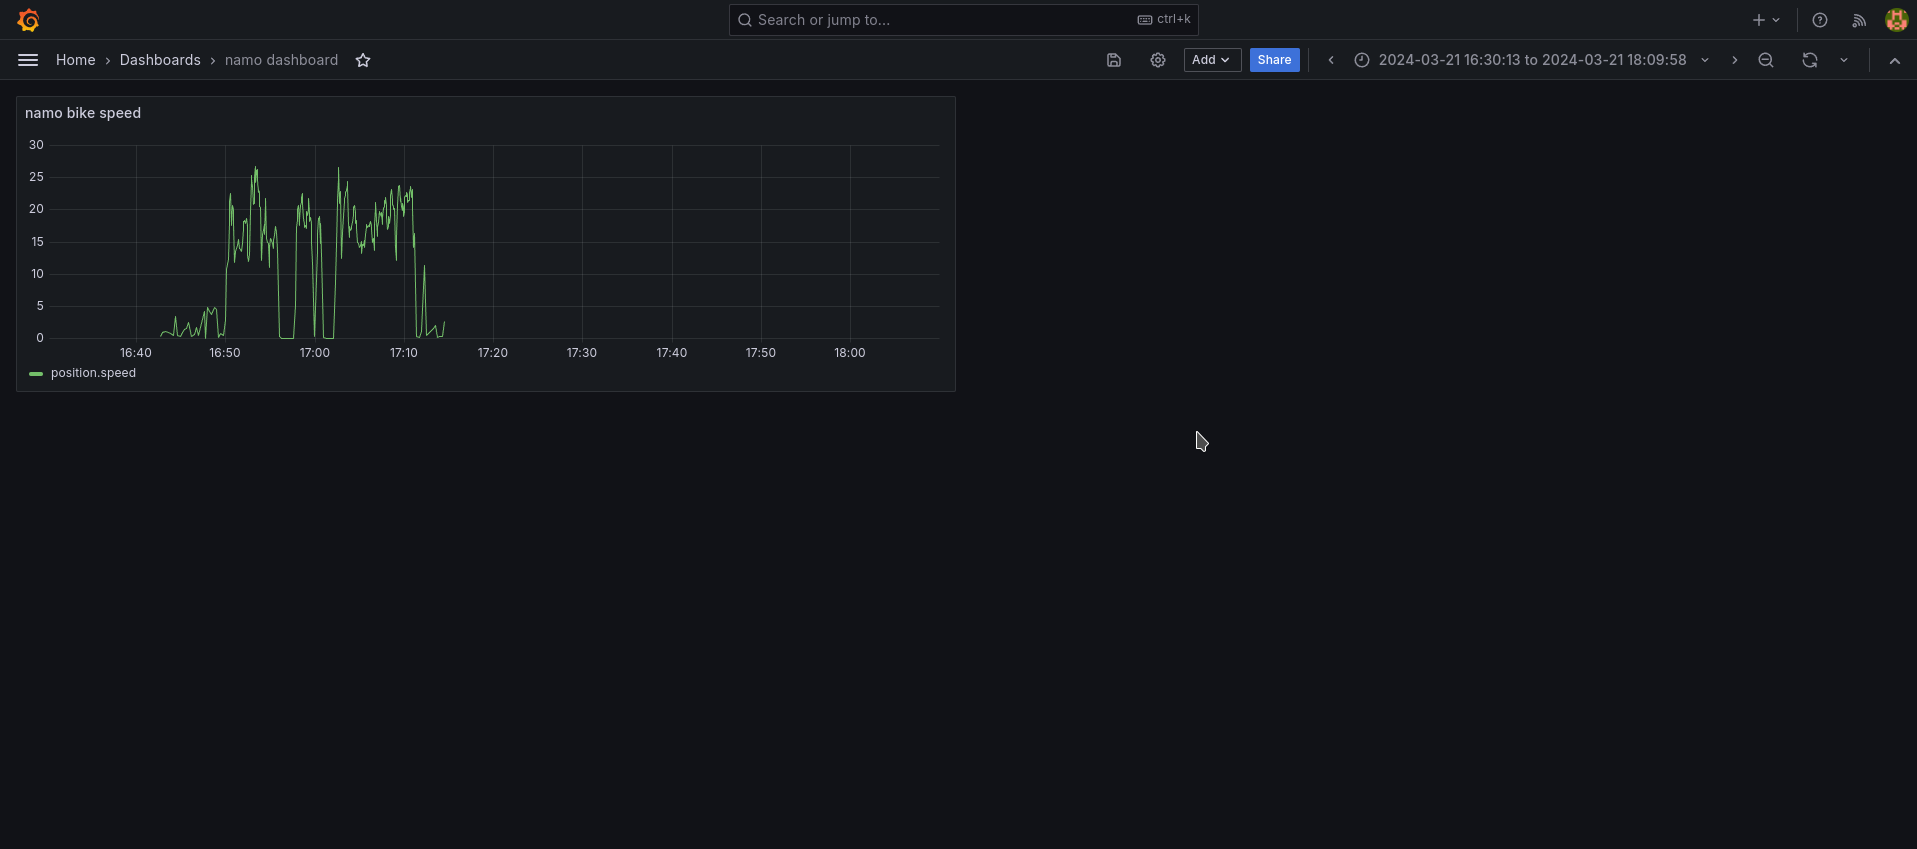
Choose the device and parameter to build a graph and save the dashboard:
In my example, I selected a flespi device representing my personal Teltonika tracker, used during my bike rides to work and back. I chose the 'position.speed' parameter to display on the graph. As a result, the dashboard displays the speed during my bike rides (revealing three traffic lights on my route from the office to home):
How to build an interactive dashboard
As soon as the ‘flespi-parameters-datasource’ plugin supports dashboard variables, you can build more complex and flexible dashboards that will allow you to display graphs of different parameters for different devices.
To illustrate this we will build a dashboard with template variables, that allows you to select a device and/or parameter in corresponding drop-downs, and dynamically rebuild the graph once the selected options have changed.
First, create dashboard variables. Go to dashboard settings (gear icon at the top of the page) > Variables and click the 'Add variable' button.
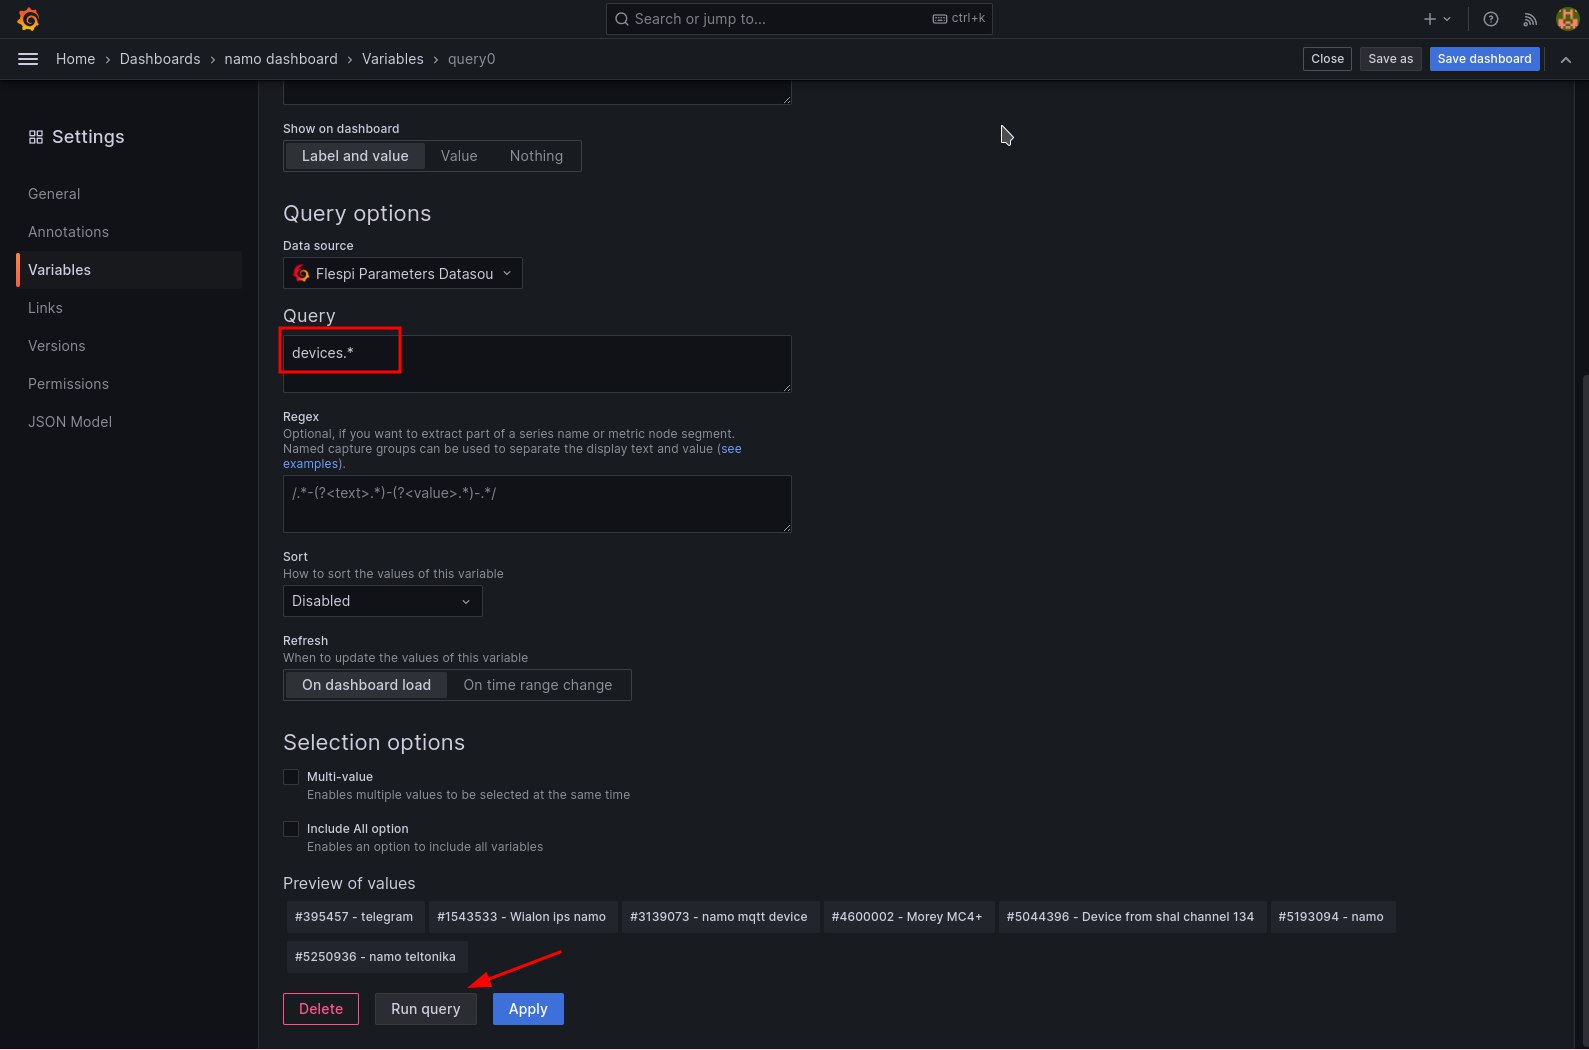
Specify variable type as Query, variable name as device, and query as devices.*. Click 'Run query'. In the 'Preview of values' section, you'll see the devices returned for this query (all devices available for the configured flespi token):
Click 'Apply' to save the device variable. Then, click 'New variable' to create another query variable for parameters.
For the second variable, specify the variable type as Query, name as param, and the query as devices.${device}.parameters.*. Click 'Apply,' and you'll see the list of newly created variables resembling this:
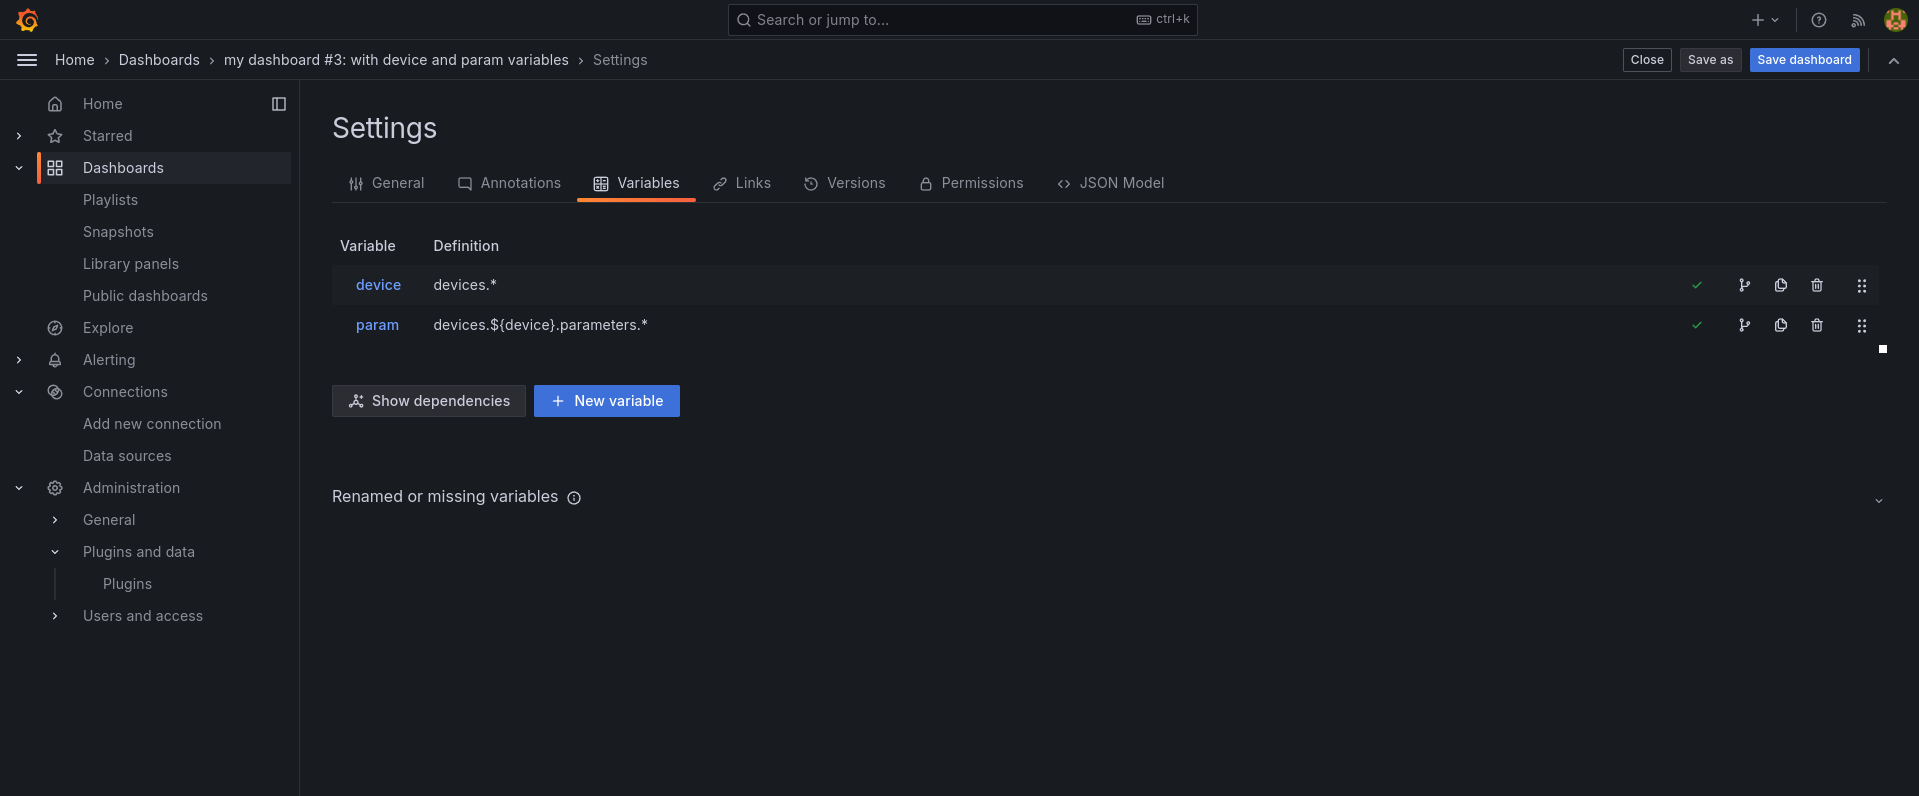
Double-check that the names (those in the Variable column) and queries (in the Definition column) of your variables correspond to the screenshot above. If everything is configured correctly, the first variable allows the selection of the device for visualization, while the second variable allows the selection of a parameter of the chosen device to be displayed on the graph.
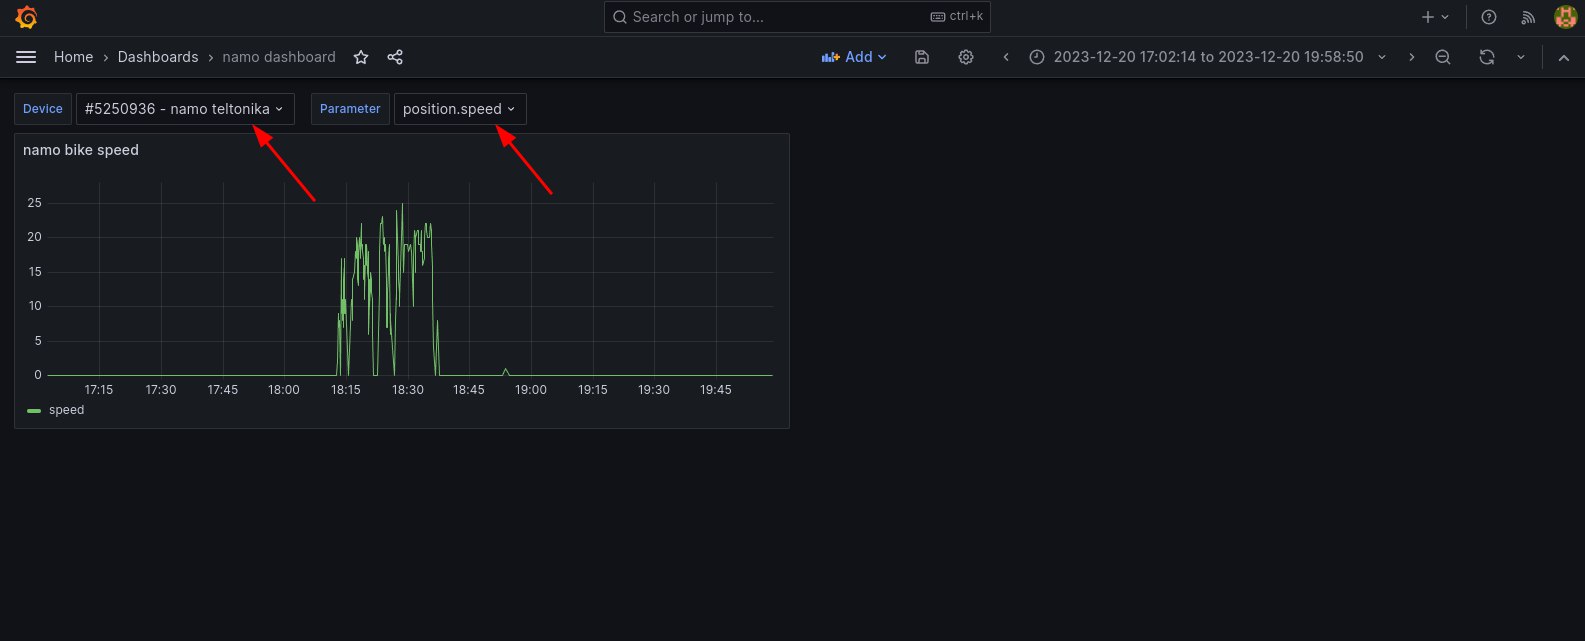
Click 'Save dashboard' in the top right corner to save the dashboard with the newly added variables. Return to the dashboard, and notice the Device and Parameter drop-down menus in the top left corner:
The next step is to create a visualization panel displaying a graph for the selected device and parameter. This graph will dynamically update when the user selects another device and/or parameter.
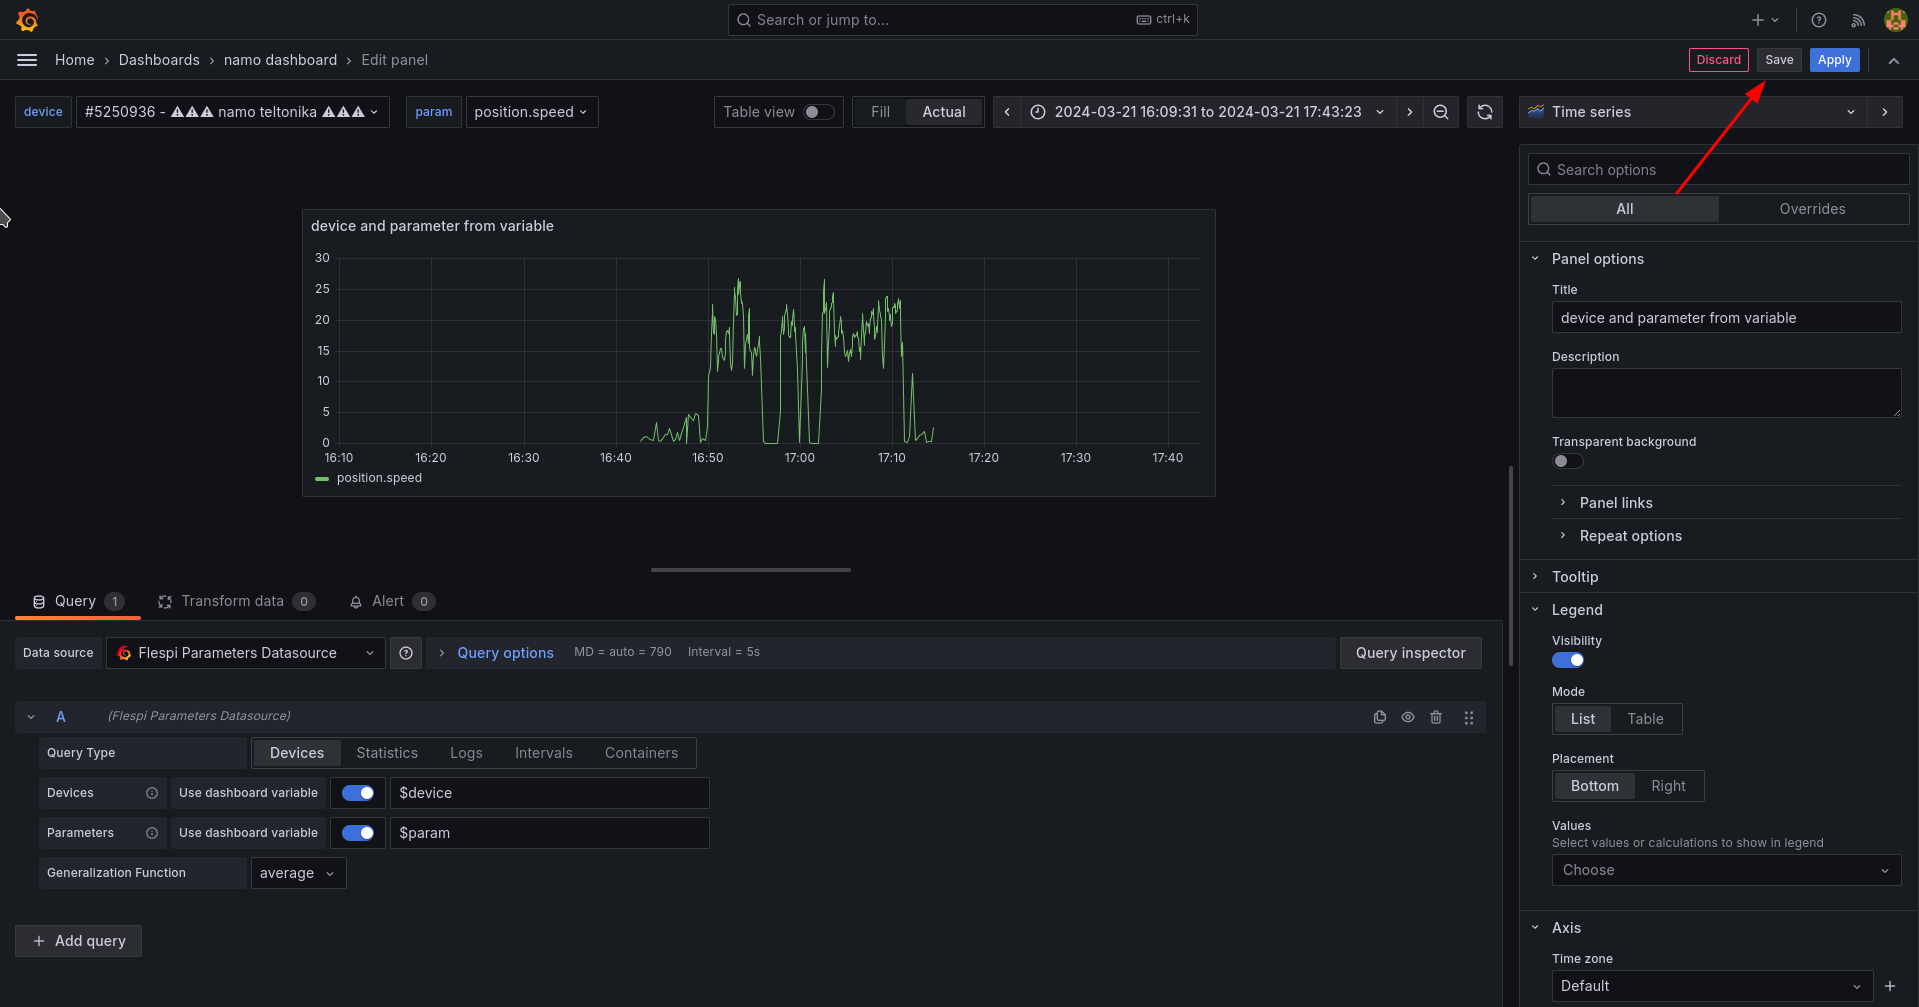
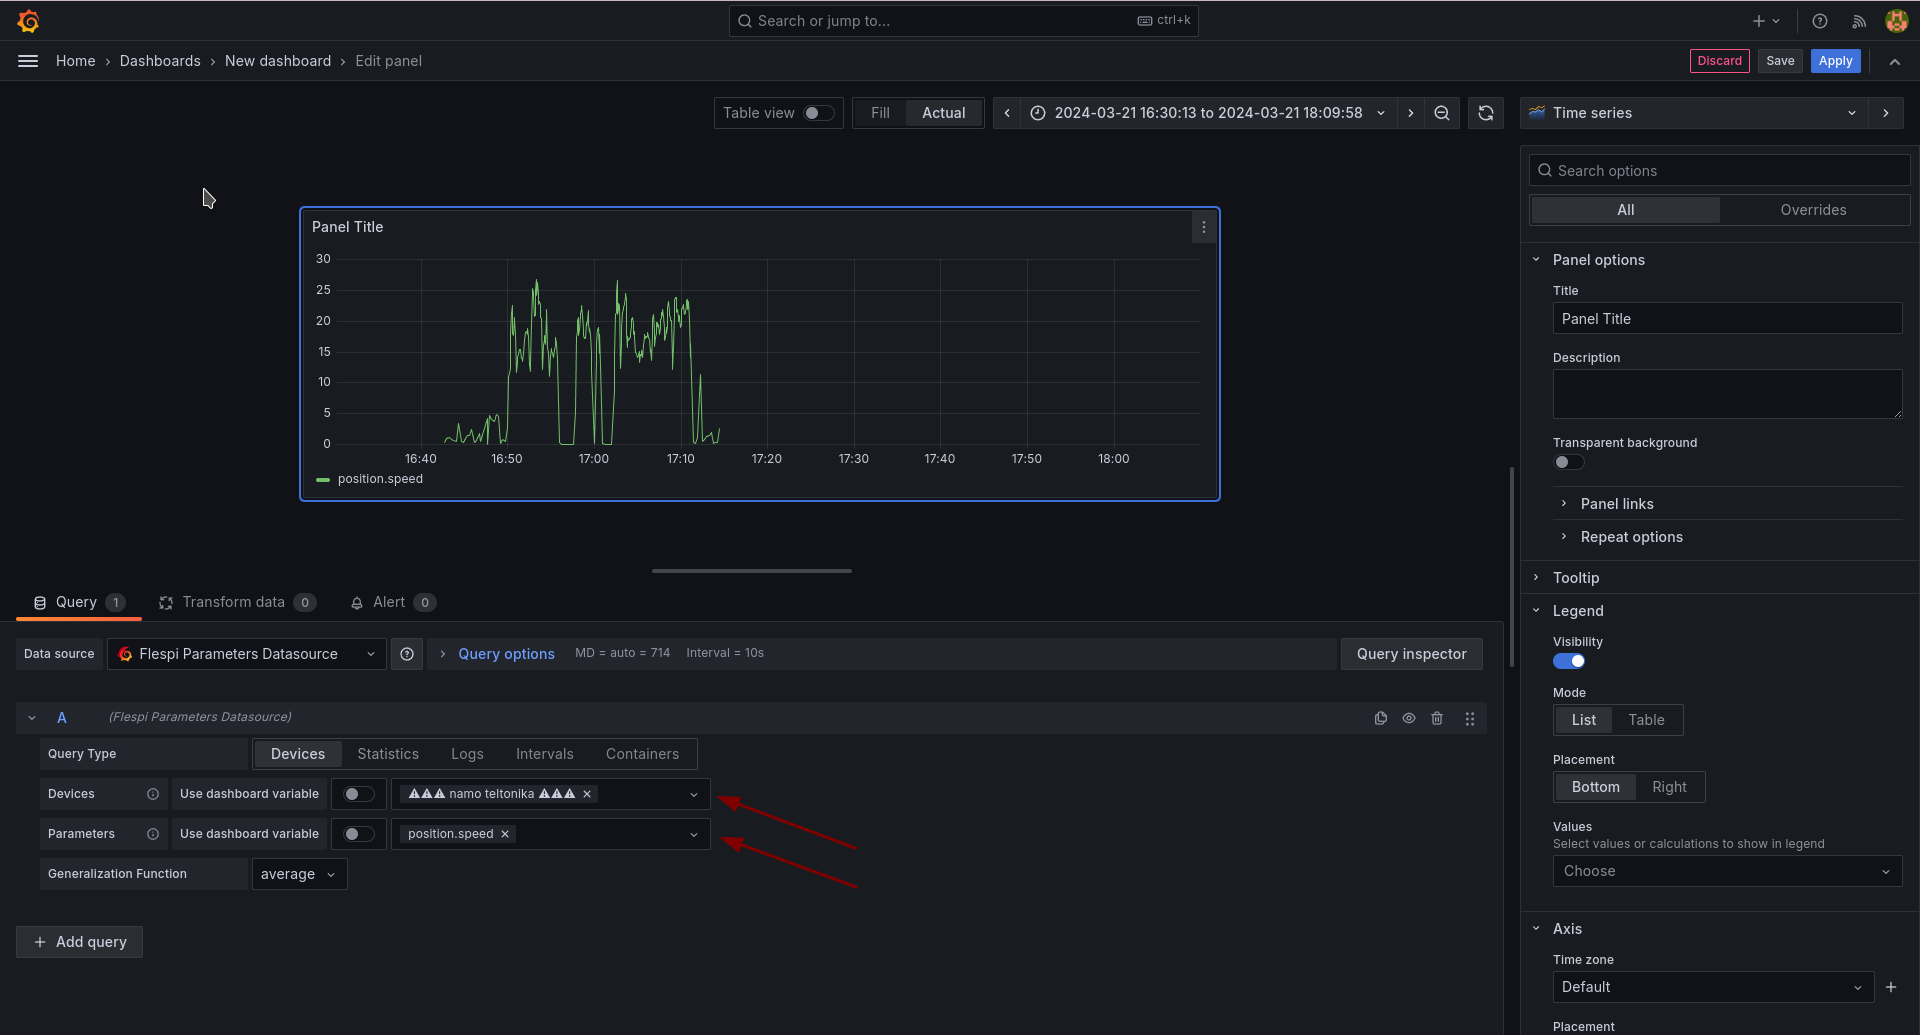
Click the 'Add' button, then select Visualization. In the query editor enable switch 'Use dashboard variable' for both Devices and Parameters sections, and type '$device' into the Devices input field and '$param' into the Parameters field:
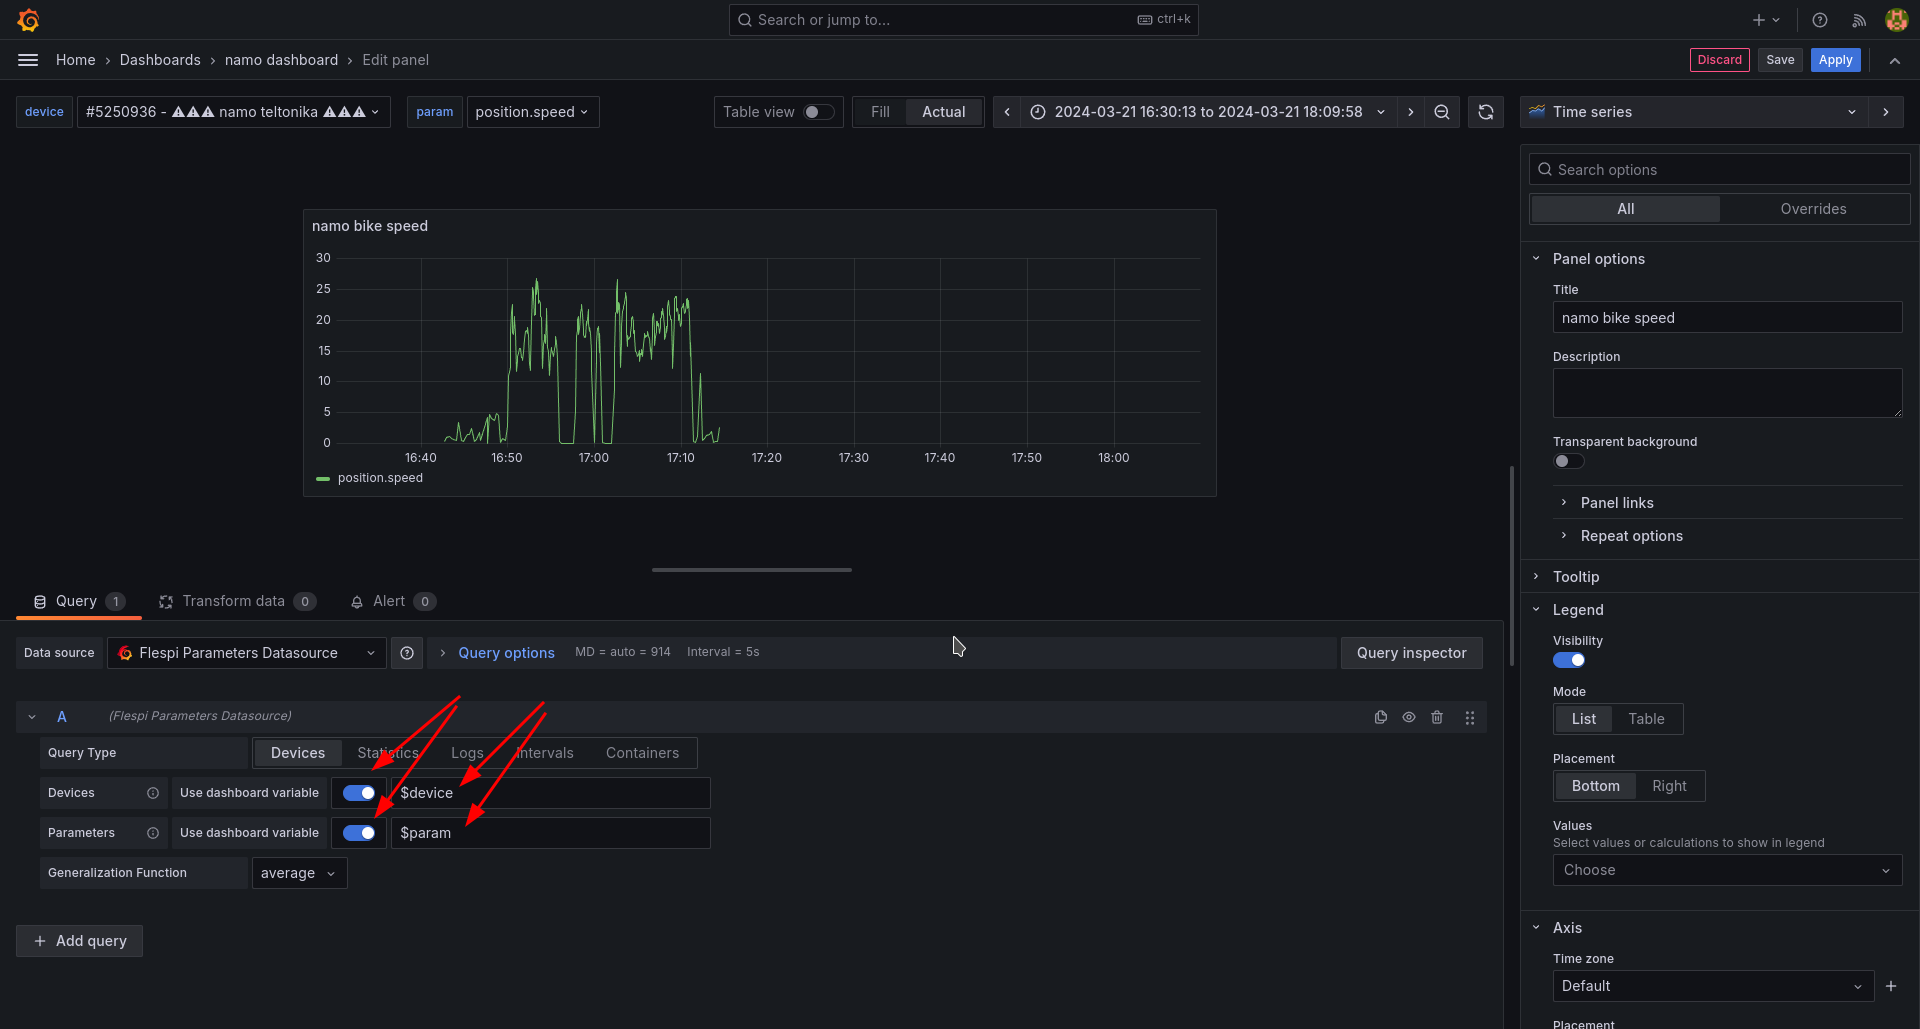
Note that the queries specified ('$device' and '$param') must match the names of the variables created initially. The panel will display the graph based on the device and parameter chosen from the drop-down menus (or, in the other words, come from data source template variables).
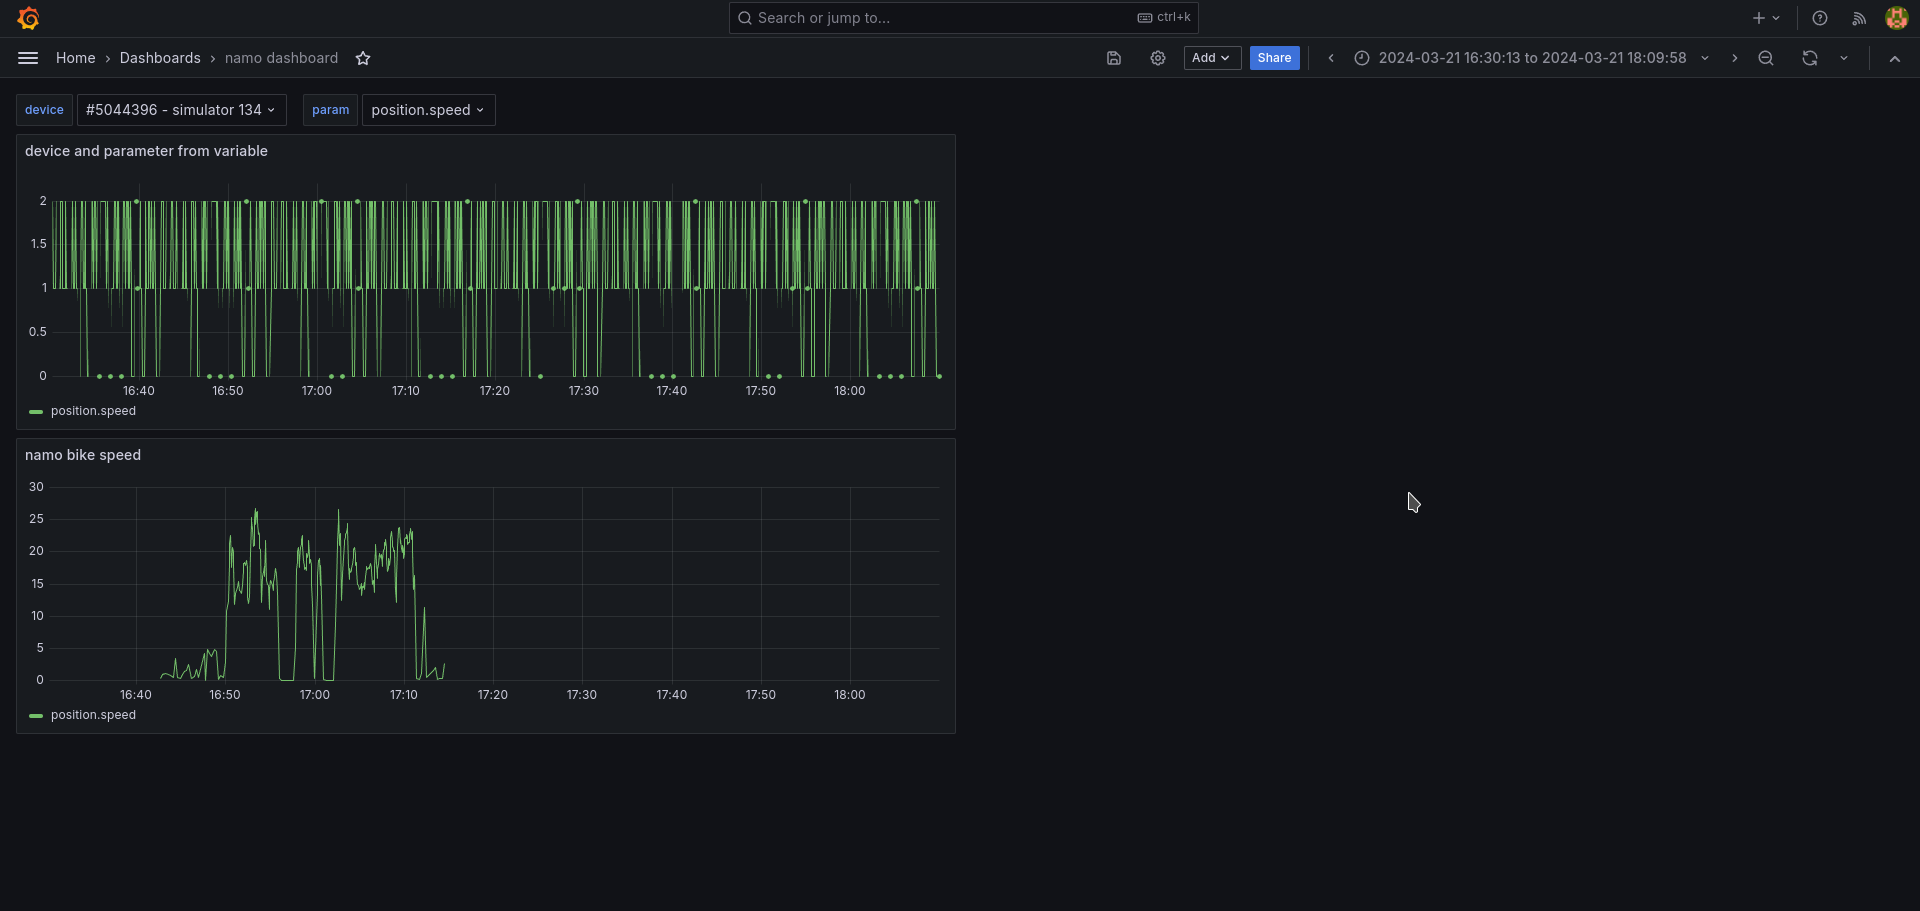
Save the dashboard and go to the dashboard itself. Now, the dashboard contains two panels. The lower panel displays my bike speed (built in the previous step), while the upper panel exhibits the graph for the device and parameter selected in the drop-down menus. Implement it yourself and observe how the graph dynamically rebuilds each time you choose another device and/or parameter:
For convenience, I've exported a dashboard containing a dynamic timeseries panel as described above. You can download, import it into your Grafana, and further customize it according to your requirements.
How to display multiple devices' charts on one panel
To track my bike tours to office and back, I use either personal tracker, or my smartphone with installed tracker app. To see the graph of my speed sourced from different flespi devices on one panel, I've just selected the two devices in the query editor's Devices field:
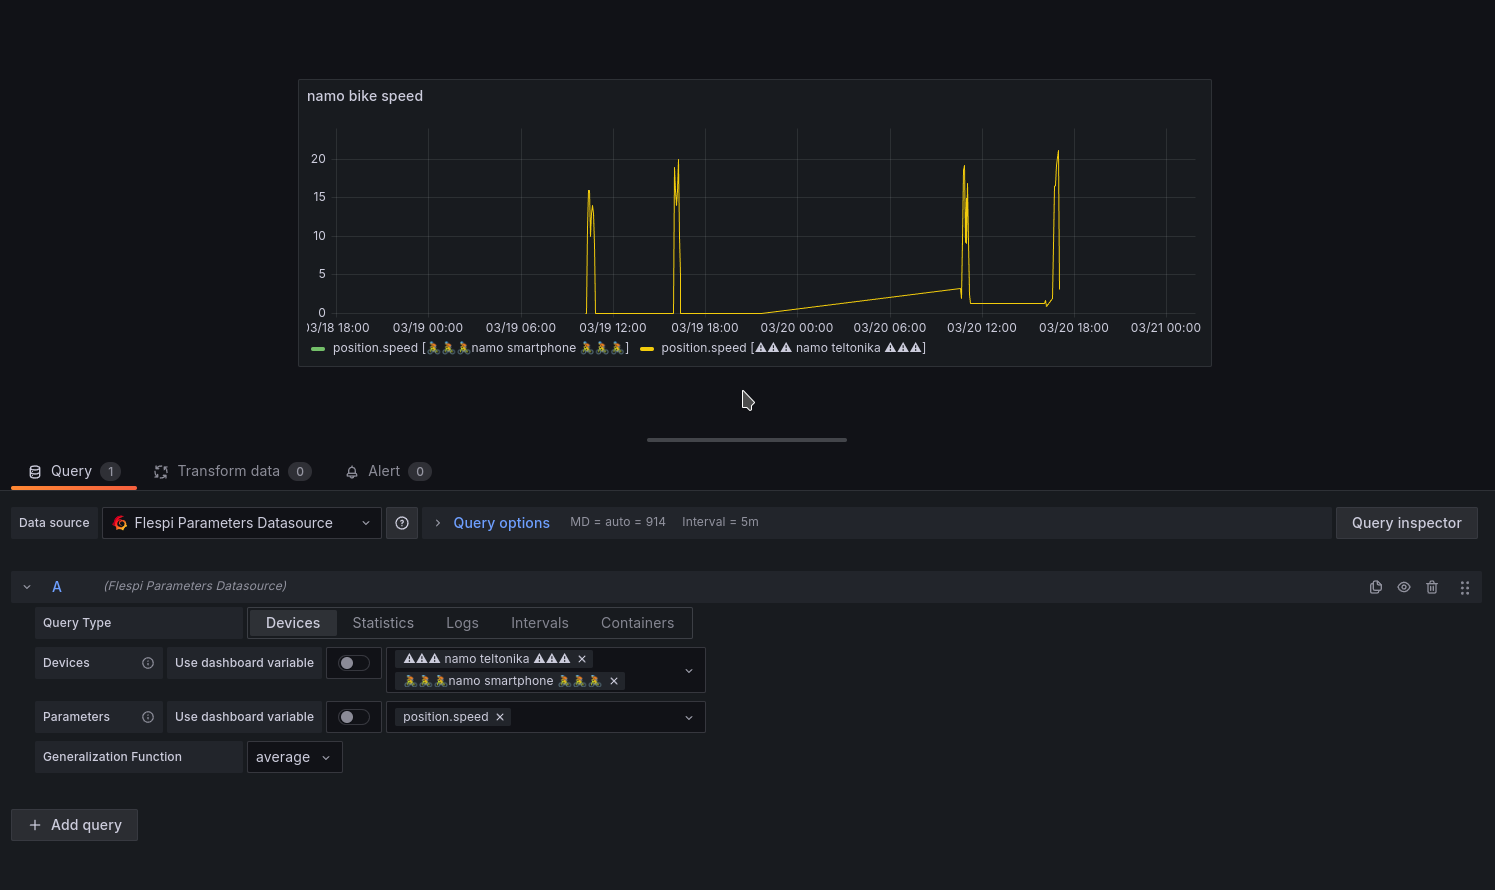
As a result, panel displays speed charts for both my trackers together. Panel's legend shows the device which this or that graph corresponds to.
How to visualize flespi account's statistics
In version 1.1.0 of ‘flespi-parameters-datasource’ plugin we added a possibility to visualize statistics of flespi account and subaccounts.
To demonstrate the idea, I've configured a panel with a graph of api_traffic and tokens_rest_traffic parameters for my account and subaccount:
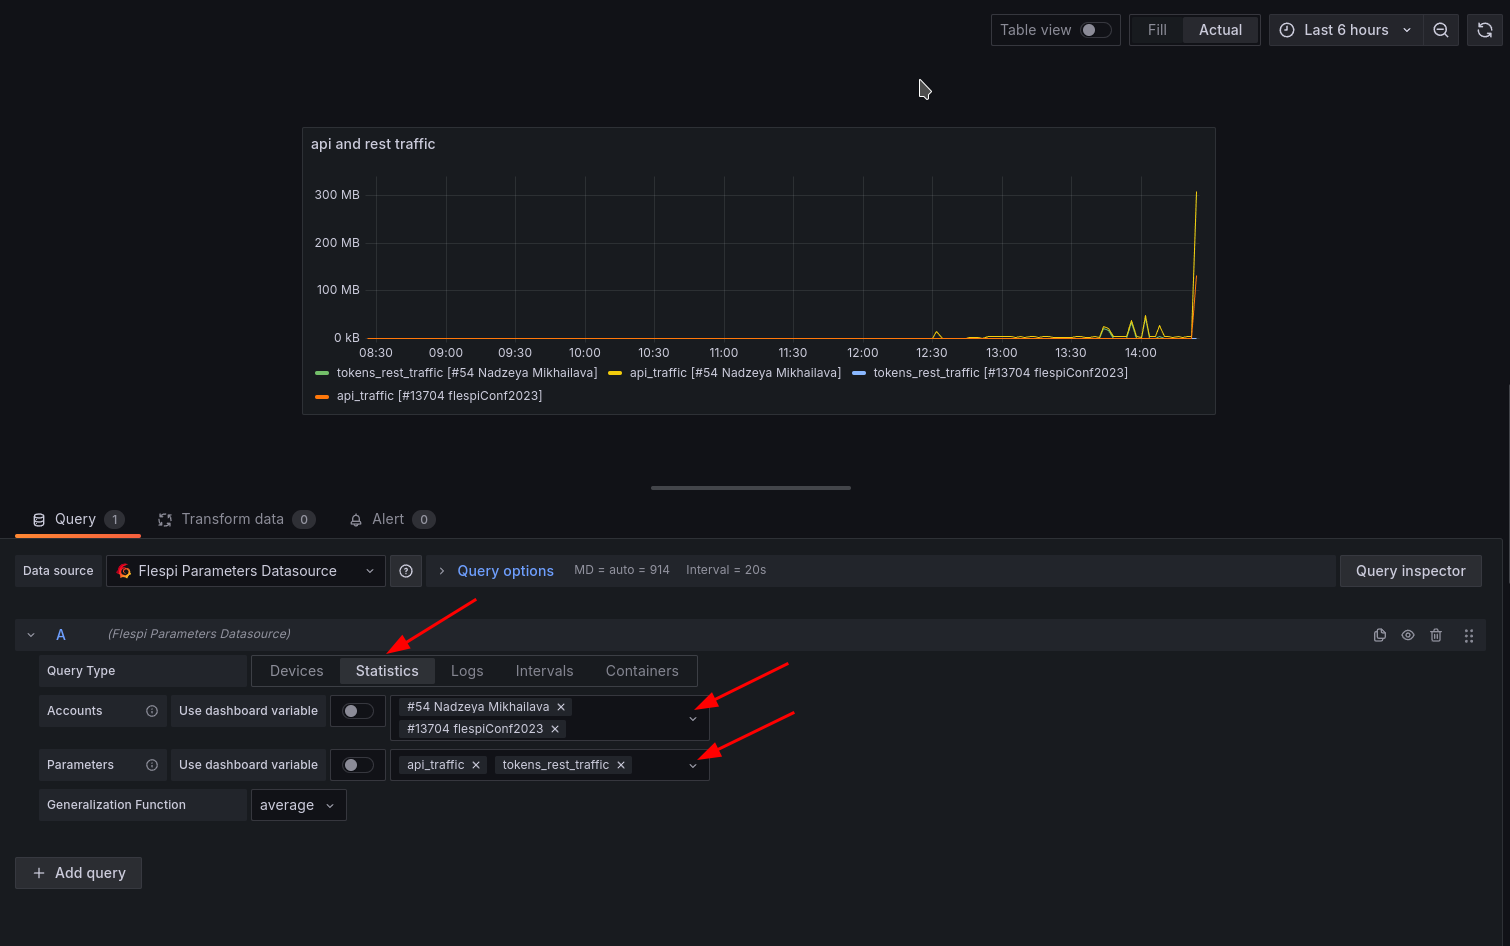
To build a panel for displaying flespi statistics, you should first switch to the Query Type 'Statistics' in query editor, and then select account and/or subaccounts and parameters to be visualized.
Interactive statistics dashboards are also supported. To build one you need to create dashboard variables. This is pretty much the same, as we did for the flespi devices in the one of the previous sections, just use the following queries instead:
| Name | Query | Description |
| account | accounts.* | fetch account and subaccounts available for given token |
| parameter | accounts.${account}.statistics.* | fetch statistics parameters for the selected account and/or subaccounts |
How to visualize logs of flespi devices and streams
The plugin is also capable to visualize numeric data from logs of flespi devices and streams.
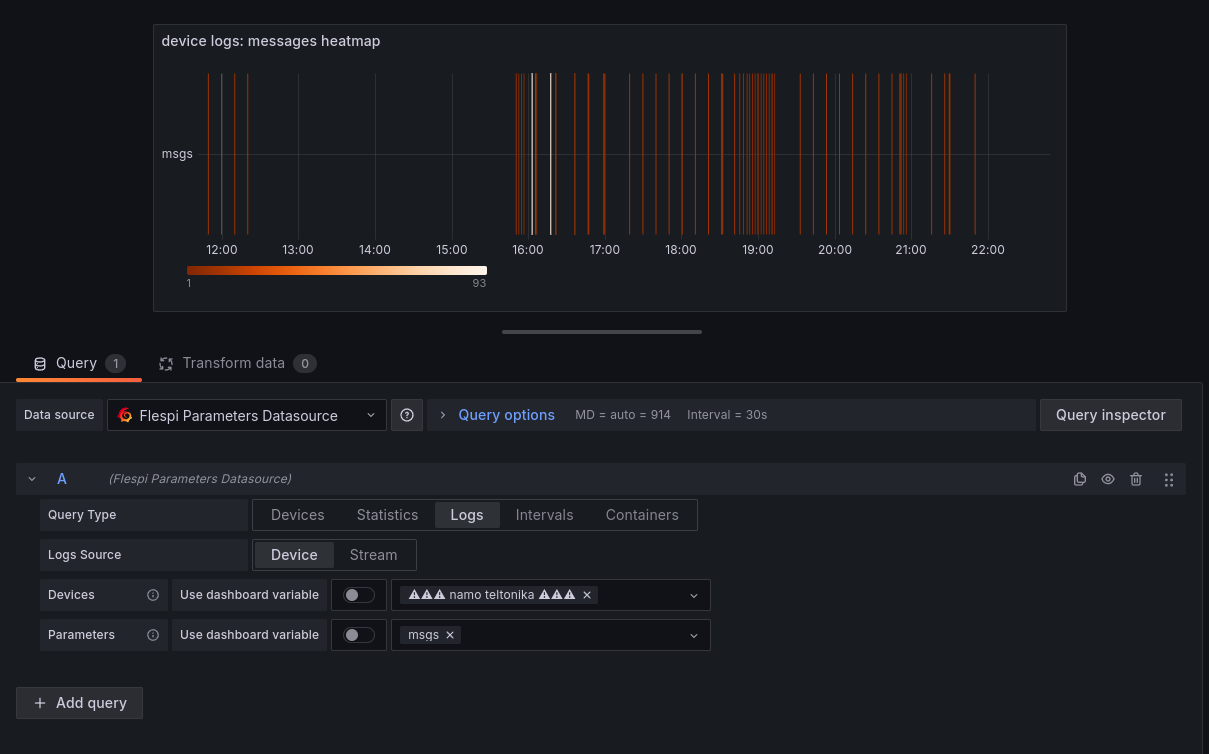
The first example demonstrates configuration of the panel, that draws device's messages heatmap. The panel displayed 'msgs' field from the logs of the selected device - the quantity of messages received through the connection. The log entry is generated at the moment when the TCP connection is closed, therefore bars on the heatmap indicate the moments of connection closure, and the color of the bars indicate how many messages was received through the connection (the lighter - the more), thus showing the intensity of data flow.
The seconds example demonstrates visualization of 'ack_latency' field from the logs of a stream. Large values of the 'ack_latency' indicate that the target server is unable to process the messages from the stream in time. Such a kind of visualization may help you to detect issues with your server:
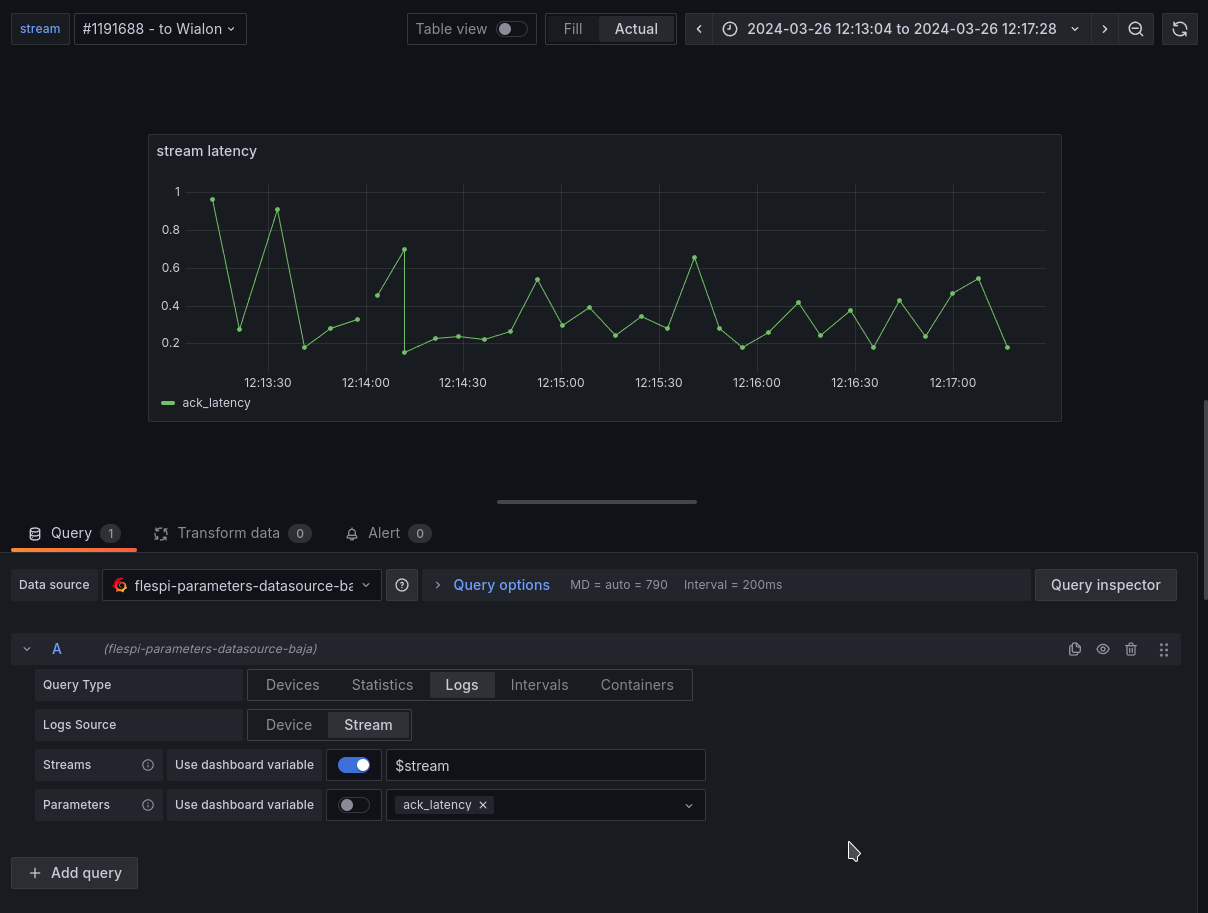
Interactive dashboards are supported for both devices' and streams' logs visualization. To be able to use dashboard variables for devices, streams or logs parameters, enable corresponding 'Use dashboard variable' switch and specify the name of the variable to be used in query (as on the screenshot above).
To create dashboard variables for device and stream, use the following queries:
| Name | Query | Description |
| device | devices.* | fetch all flespi devices available for given token |
| stream | streams.* | fetch all flespi streams available for given token |
To create a dashboard variable for logs parameters, select variable type 'Custom' and specify a comma-separated list of possible options:
![]()
Change log
Subscribe to the flespi-parameters-datasource plugin change log to stay in sync with any updates.
⚠️ Backward compatibility note
The section below is applicable for those who have dashboards configured for the plugin's version 1.0.0. If not, you may simply stop reading here.
Version 1.1.0 of the plugin uses a new query model, that differ from that was used in the previous version.
A special backward compatibility mechanism is included in the new plugin's version, so that the dashboards that are configured for the previous version of the plugin, continue working in the version 1.1.0 as well.
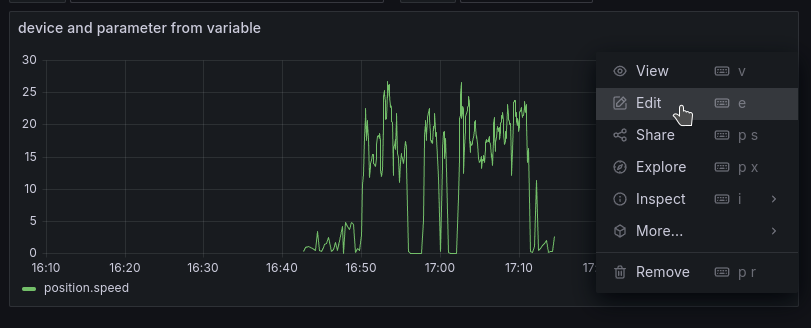
However, it's recommended to re-save the panels under the new version of the plugin. This will ensure that the panels will keep working when the mechanism will be removed. To do this just open the panel for editing and then his 'Save' button to save the panel with updated query model:
Step 1
Step 2