When you run a complex transportation/logistics/delivery or other business, you want simple and handy monitoring tools to oversee its operation. With flespi analytics giving you access to instant insights from loads of collected telemetry data, it only takes proper visualization to deliver its value to the customer.
What we want to showcase here is how to build a basic telematics dashboard in the MQTT Tiles tool powered by flespi analytics calculators. The results of all intervals calculations in flespi are immediately available via MQTT, so with MQTT Tiles, you will get real-time updates for all metrics, routes, and statuses without the need to repeatedly refresh the page.
We have a detailed guide showing the principles of MQTT Tiles operation, so here we will focus on the aspects related to visualizing the results of flespi analytics calculations.
If you want to get the curl and board templates and play with them without further ado, fast-forward to the end of the article.
Route on the map
One of the key widgets on the telematics dashboard will be a map. MQTT Tiles offer two modes of a map — one showing the position (dot on the map) and another showing the current/last route traveled by the unit.
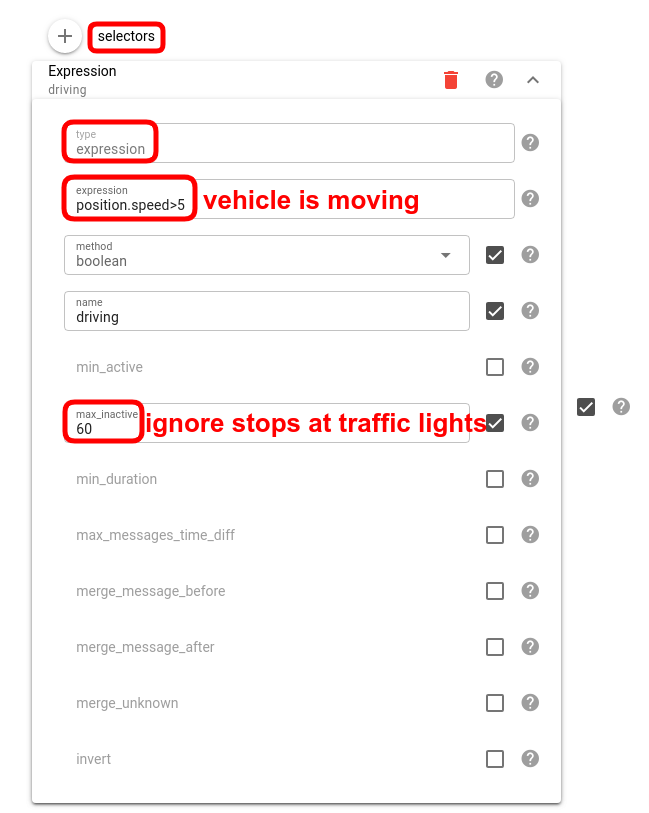
To make flespi analytics calculate the routes for us, we need to create a calculator in the flespi panel with the following configuration (or similar to this):
Selectors determine the rules for intervals calculation (the vehicle is moving faster than some threshold speed, plus we ignore stops shorter than 1 minute):
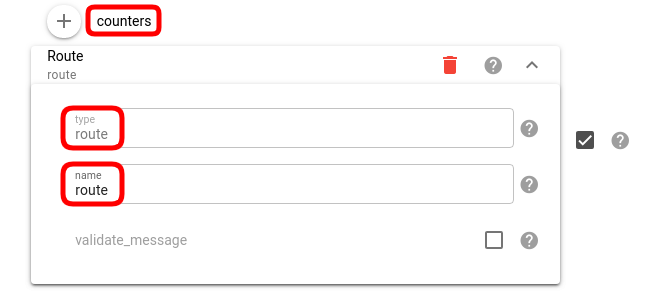
Counters define what data we want to extract from the calculator (in our case we only need the route):
Now let’s add and configure the Map (route) widget in MQTT Tiles to display the track for the last trip (find how to create a connection, board, and widget in MQTT Tiles):
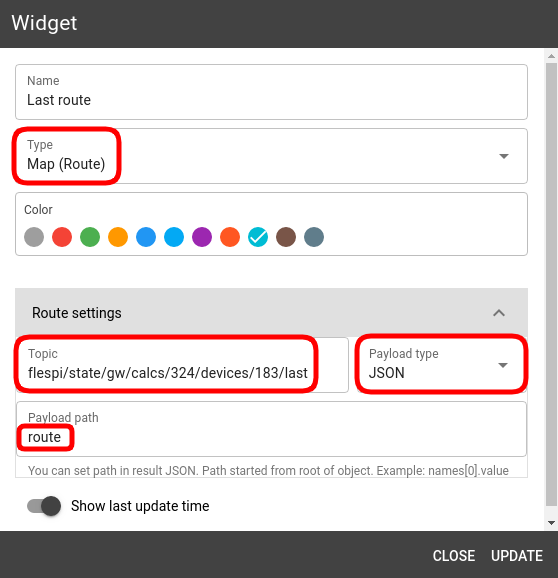
Note: the topic should obviously contain your calculator and device ids.
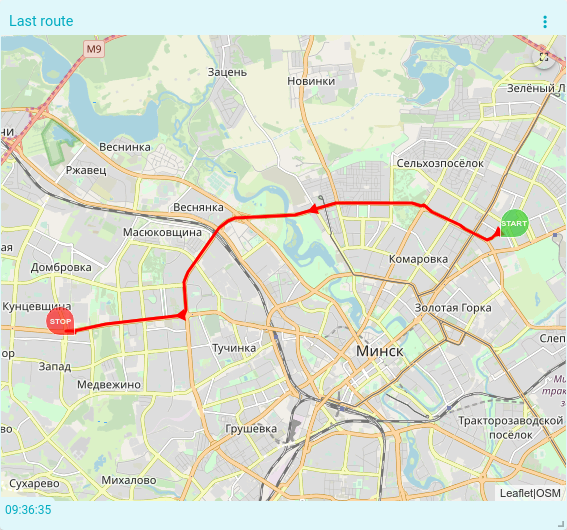
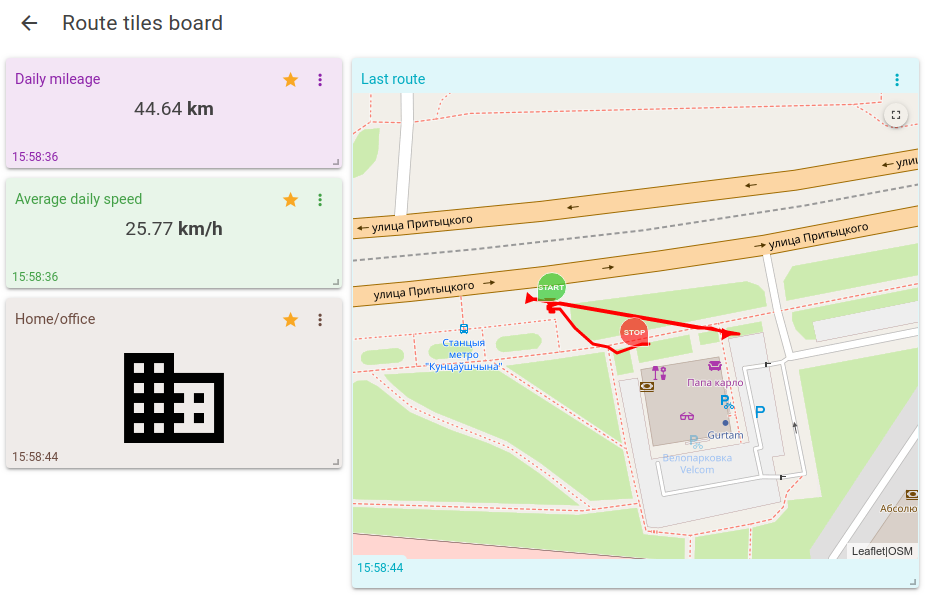
The result will be like:
Daily stats
It may also be nice to have some aggregated metrics about your fleet. Let’s calculate the daily mileage and average speed for a vehicle.
We create a new calculator with the following config
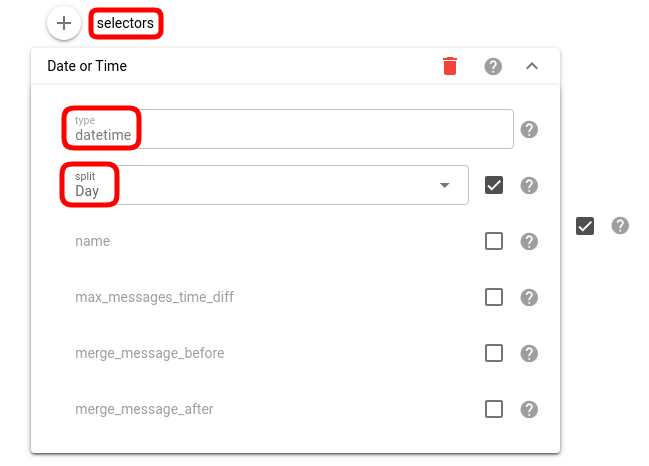
Selectors (split by day):
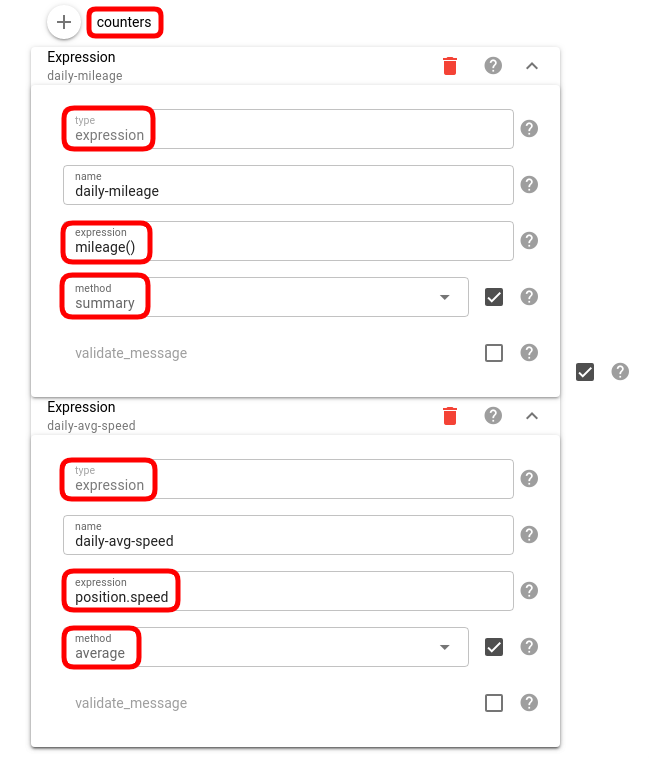
Counters (one for mileage and one for speed):
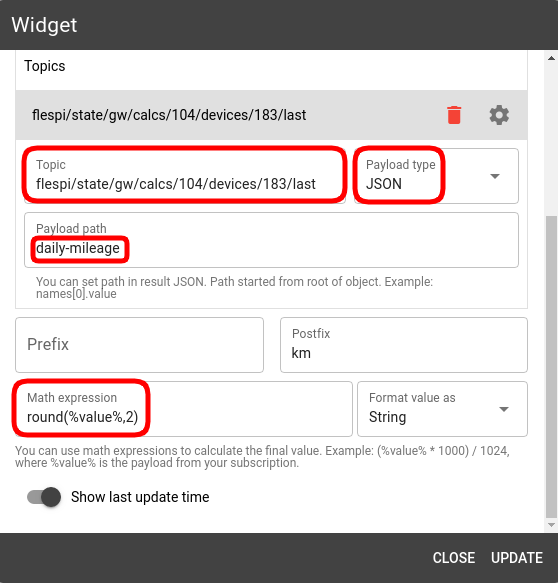
Then we add several Text widgets in MQTT Tiles and configure them.
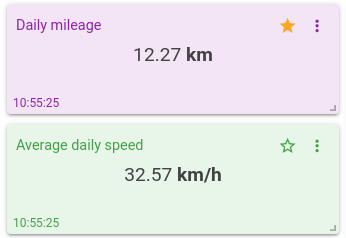
For daily mileage:
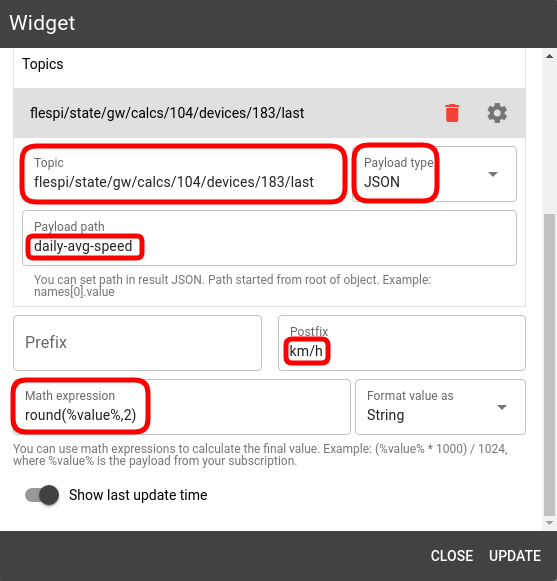
For average speed:
And here are the resulting values:
Geofence indicator
Lastly, we will create an indicator showing whether the vehicle is at home or at work.
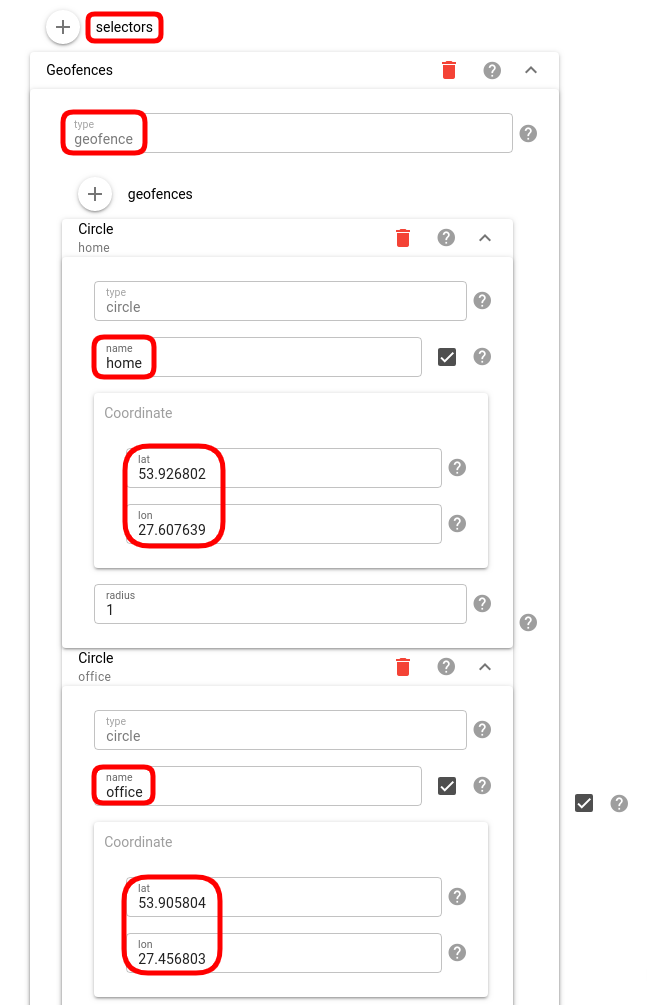
The calculator for this purpose should be configured like this
Selectors (two circular geofences 1km in radius):
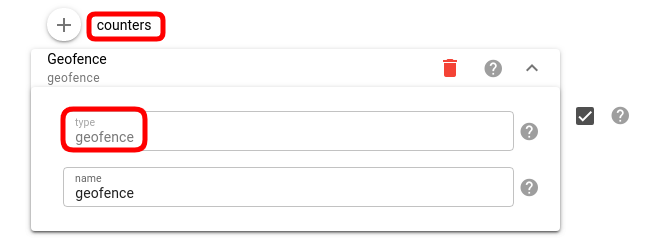
Counters (geofence type):
In MQTT Tiles, we create a Status indicator widget and configure it as follows:
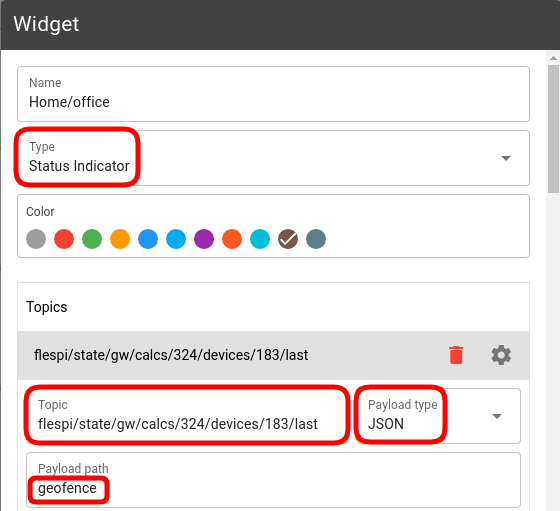
and
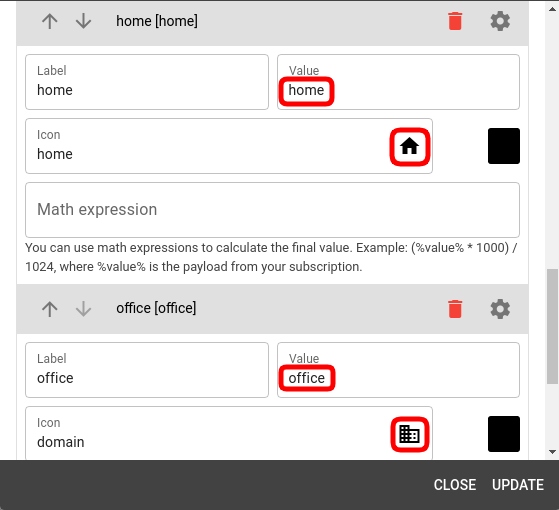
Note: the values correspond to the names of your geofences in the calculator selectors.
And here’s what we get in the result:
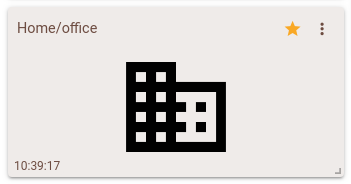
The icon will change when the vehicle enters another geofence.
All for you
If you don't want to create calculators and boards from scratch, we'll give you a helping hand.
Run this curl request to get three calculators from the article in your account (paste your token instead of Xs):
curl -X POST --header 'Content-Type: application/json' --header 'Accept: application/json' --header 'Authorization: FlespiToken XXXXXXXXXXXXXXXXXXXXXXXXXXXXXXXXXXXXXXX' -d '[{"counters": [{"expression": "mileage()","method": "summary","name": "daily-mileage","type": "expression"},{"expression": "position.speed","method": "average","name": "daily-avg-speed","type": "expression"}],"intervals_rotate": 0,"intervals_ttl": 31536000,"messages_source": {"source": "device"},"name": "daily-mileage","selectors": [{"split": "day","type": "datetime"}],"timezone": "Europe/Minsk","update_delay": 30,"update_period": 31536000,"validate_interval": "","validate_message": ""},{"counters": [{"name": "route","type": "route"}],"intervals_rotate": 0,"intervals_ttl": 31536000,"messages_source": {"source": "device"},"name": "route","selectors": [{"expression": "position.speed>5","max_inactive": 60,"method": "boolean","name": "driving","type": "expression"}],"update_delay": 30,"update_period": 31536000,"validate_interval": "","validate_message": ""},{"counters": [{"name": "geofence","type": "geofence"}],"intervals_rotate": 0,"intervals_ttl": 31536000,"messages_source": {"source": "device"},"name": "office-home","selectors": [{"geofences": [{"center": {"lat": 53.926802,"lon": 27.607639},"name": "home","radius": 1,"type": "circle"},{"center": {"lat": 53.905804,"lon": 27.456803},"name": "office","radius": 1,"type": "circle"}],"type": "geofence"}],"update_delay": 30,"update_period": 31536000,"validate_interval": "","validate_message": ""}]' 'https://flespi.io/gw/calcs?fields=id'You will get three calculators with the names route, daily-mileage, and office-home. Note that if you already have calculators created in your free account, you may hit the limit (5 calcs) and not all of the calculators will be created.
You can also download the MQTT Tiles board configuration from here. Then open MQTT Tiles, click the Import button on the top right, and pick the saved configuration file.
Give access to view the board by sharing it with all interested parties.
***
The MQTT Tiles IoT and telematics dashboard creation tool has immense capabilities thanks to its flexible architecture and wide range of supported widgets. What makes it even more attractive, is its open-source nature — fork it on Github and adapt to your project needs (here’s a project already doing so).
Explore the world of flespi analytics and find more ways to visualize various aspects of your business.