The slogan for the flespi platform states “from developers to developers.” But we are not inviting you to the command prompt — instead, we are making your experience more visual and intuitive. Dashboard and Graph are the two big advancements in the flespi panel we want to present.
Dashboard
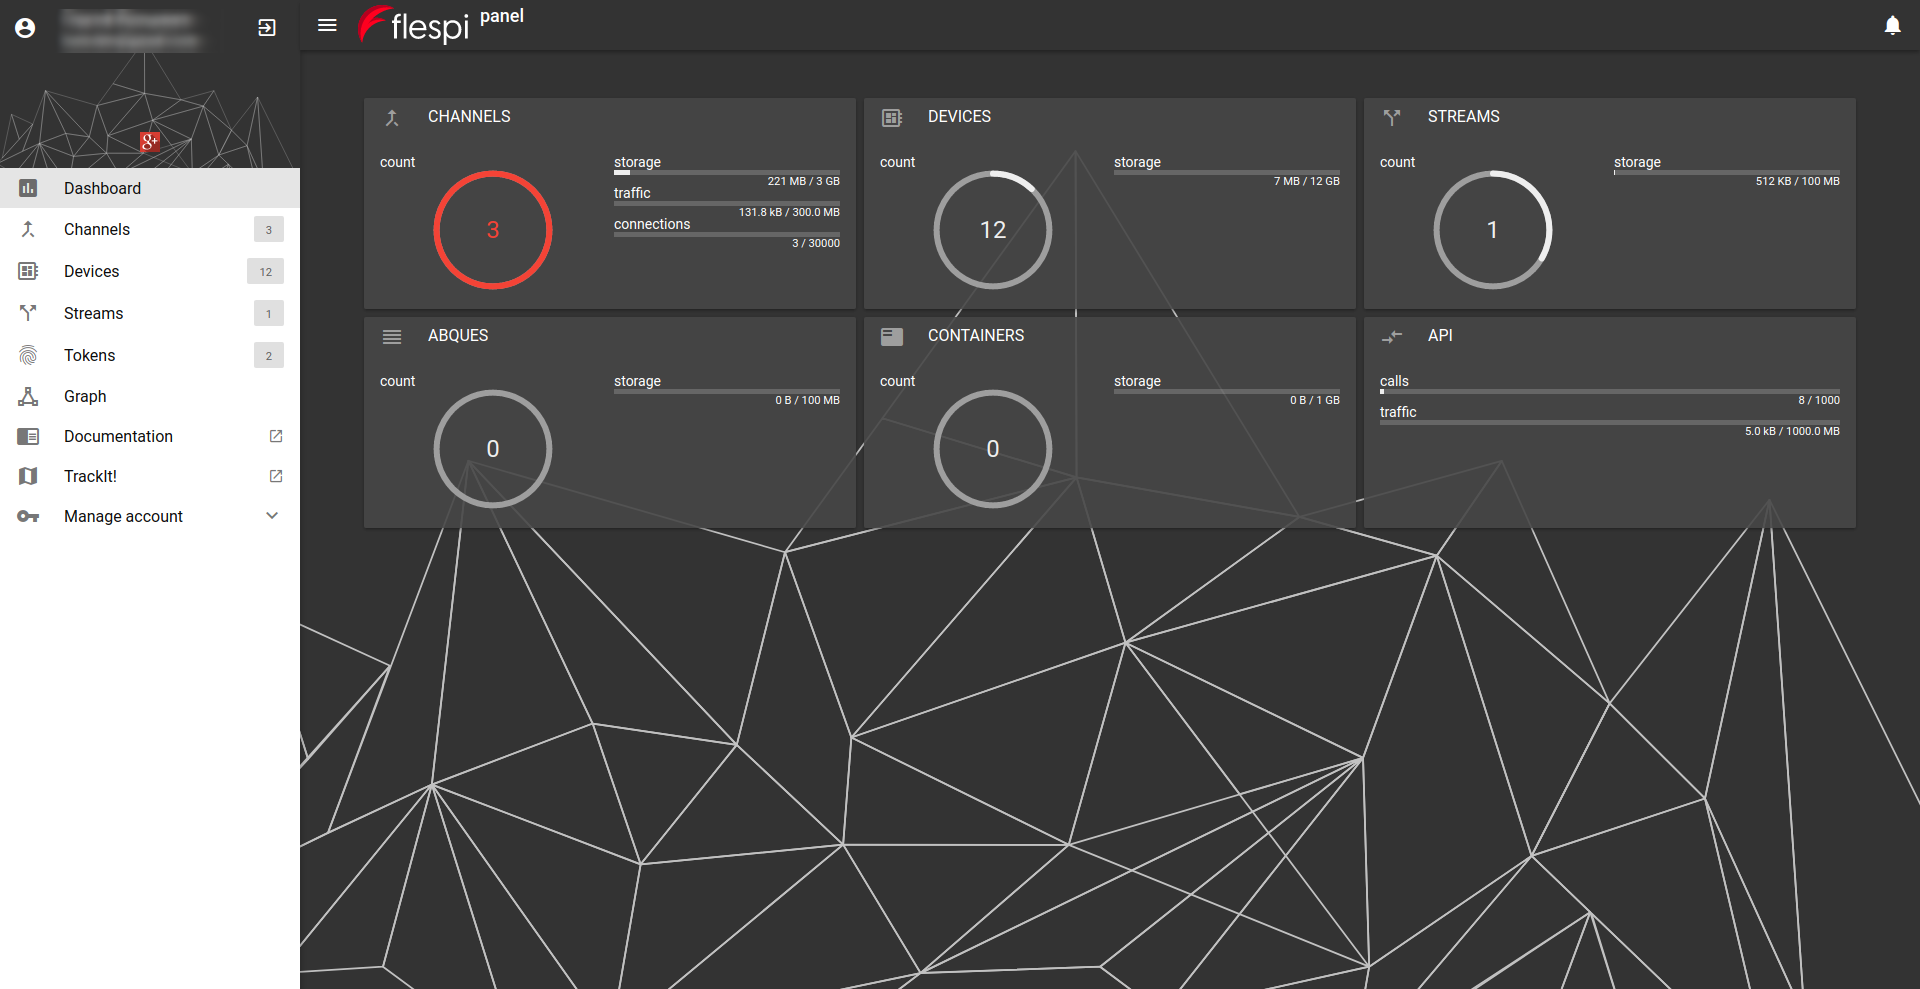
It does look like a pilot dashboard, right? And it serves a similar purpose — shows your level of the flespi platform utilization across all key components. In essence, this is a clearer and easier to understand representation of the platform restrictions on the same screen:
- Channels — the protocol-specific pipelines delivering telematics data from the physical devices into the flespi platform — are controlled for quantity (three for free, extra for a fee), storage, traffic, and the number of connections.
- Devices — registered virtual devices within the flespi platform — are controlled for quantity (100 for free, extra for a fee) and storage.
- Streams - instances that subscribe to channels and devices to aggregate and forward data into the third-party platforms — are controlled for quantity (three for free, extra for a fee) and storage.
- Abques — special queue-type storage — are controlled for quantity (100 for free, extra for a fee) and storage.
- Containers — a simple key:value database — are controlled for quantity (100 for free, extra for a fee) and storage.
- API — REST API calls — are controlled for quantity (1000 for free, 10 000 for commercial use) and traffic per minute.
See how close you are to the limits and how quickly you are approaching them, and make a decision to extend the thresholds or take other action proactively to avoid suspension. No worries, even with the storage limit exceeded, no data will ever get lost — we will just start billing you for extra gigabytes.
Just log in to flespi.io with any social network account to start creating the infrastructure and see the usefulness of the dashboard firsthand.
Graph
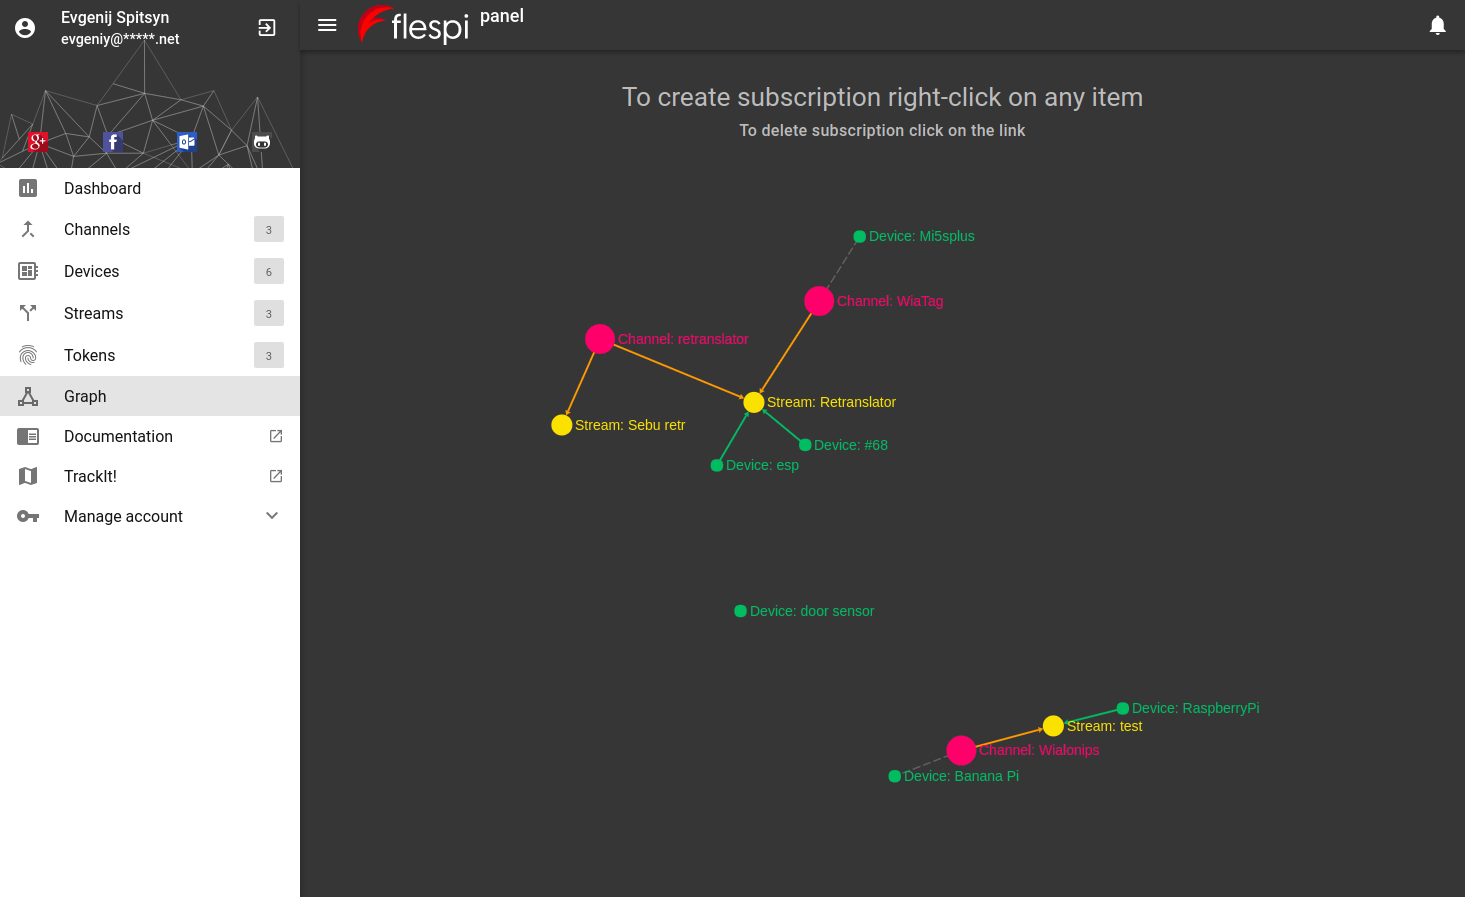
Graph is the most intuitive, colorful, and convenient way to create subscriptions — two mouse clicks and there you have it. One click, and it’s gone. Zoom in and out with a mouse scroll. The hints at the top will guide you through the process. The types of instances are color-coded: streams — yellow, channels — crimson, devices — green.
The current functionality allows subscribing streams to channels and devices to forward message into third-party platforms. The range of tasks performed on the graph will extend over time, and we will let you know.
Device cards
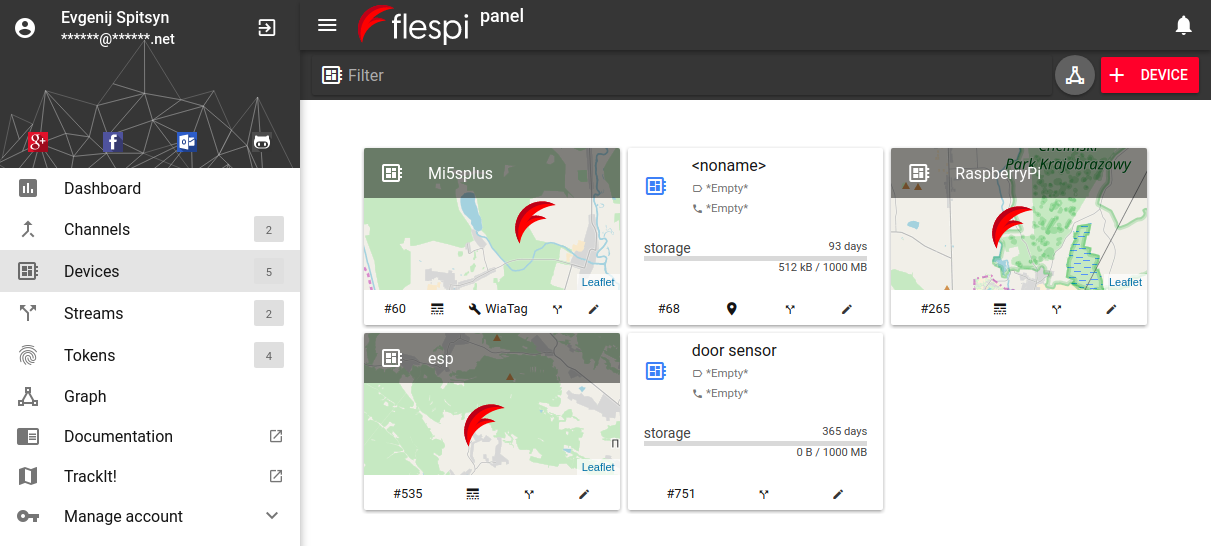
A tiny nicety appeared in the device cards — if a device transmits messages with location information, the card can visualize it — just click the tiny pin icon:
Even though flespi is a backend platform, we care not only about security and reliability but also about the people working with the product. We are always on the lookout for new ways to improve usability. We’d be happy to hear your ideas and suggestions on this matter. Contact us anytime.
And since a picture is worth a thousand words, we’ll stop here and invite you to try our new features live.