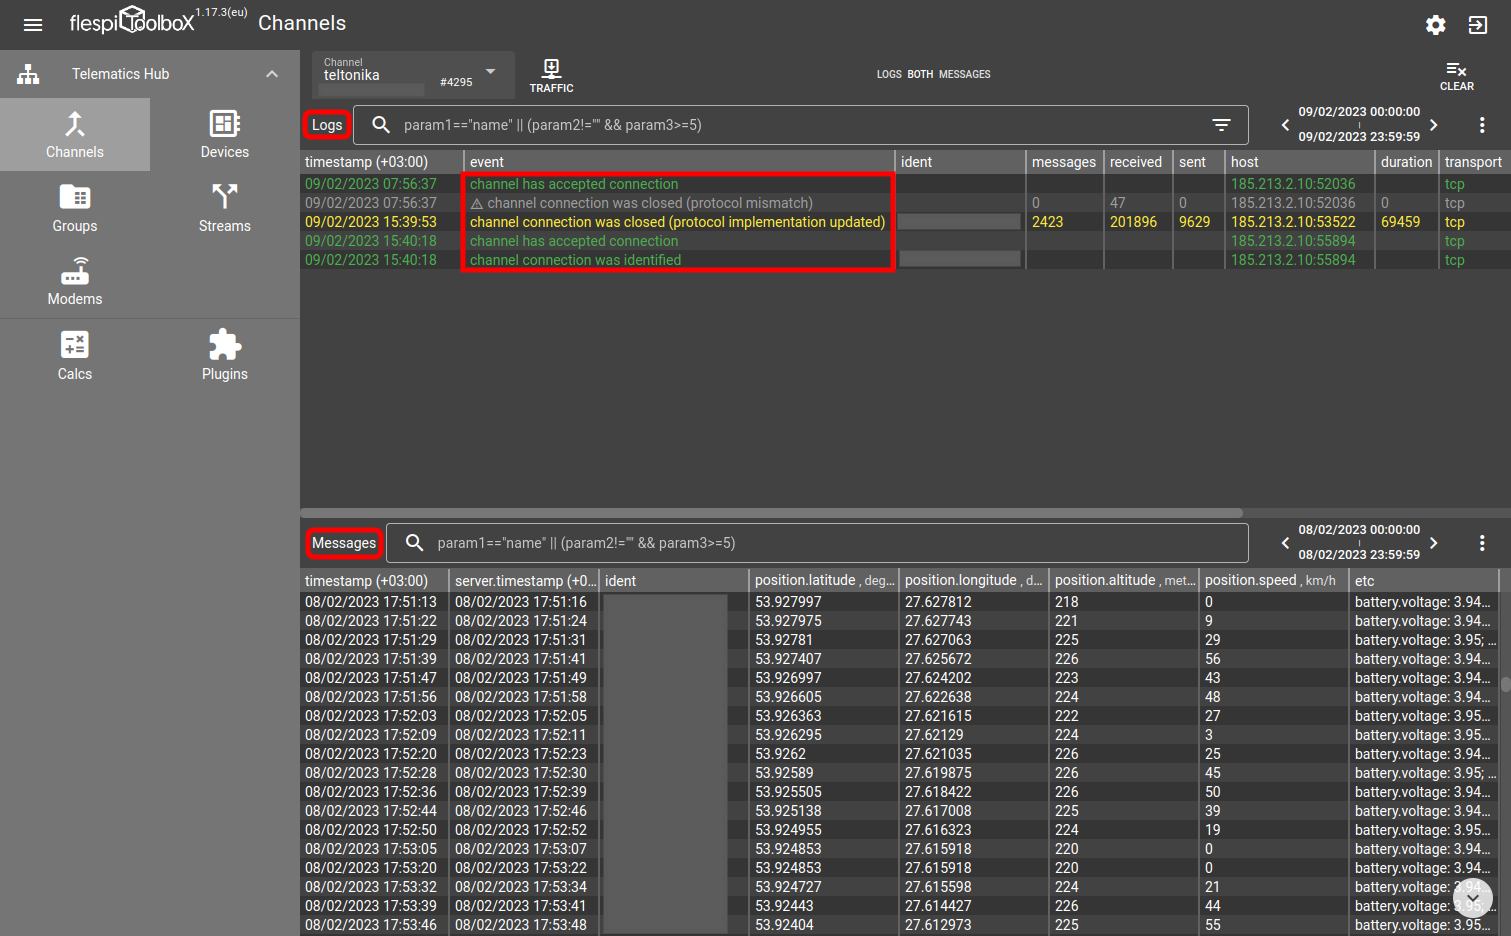
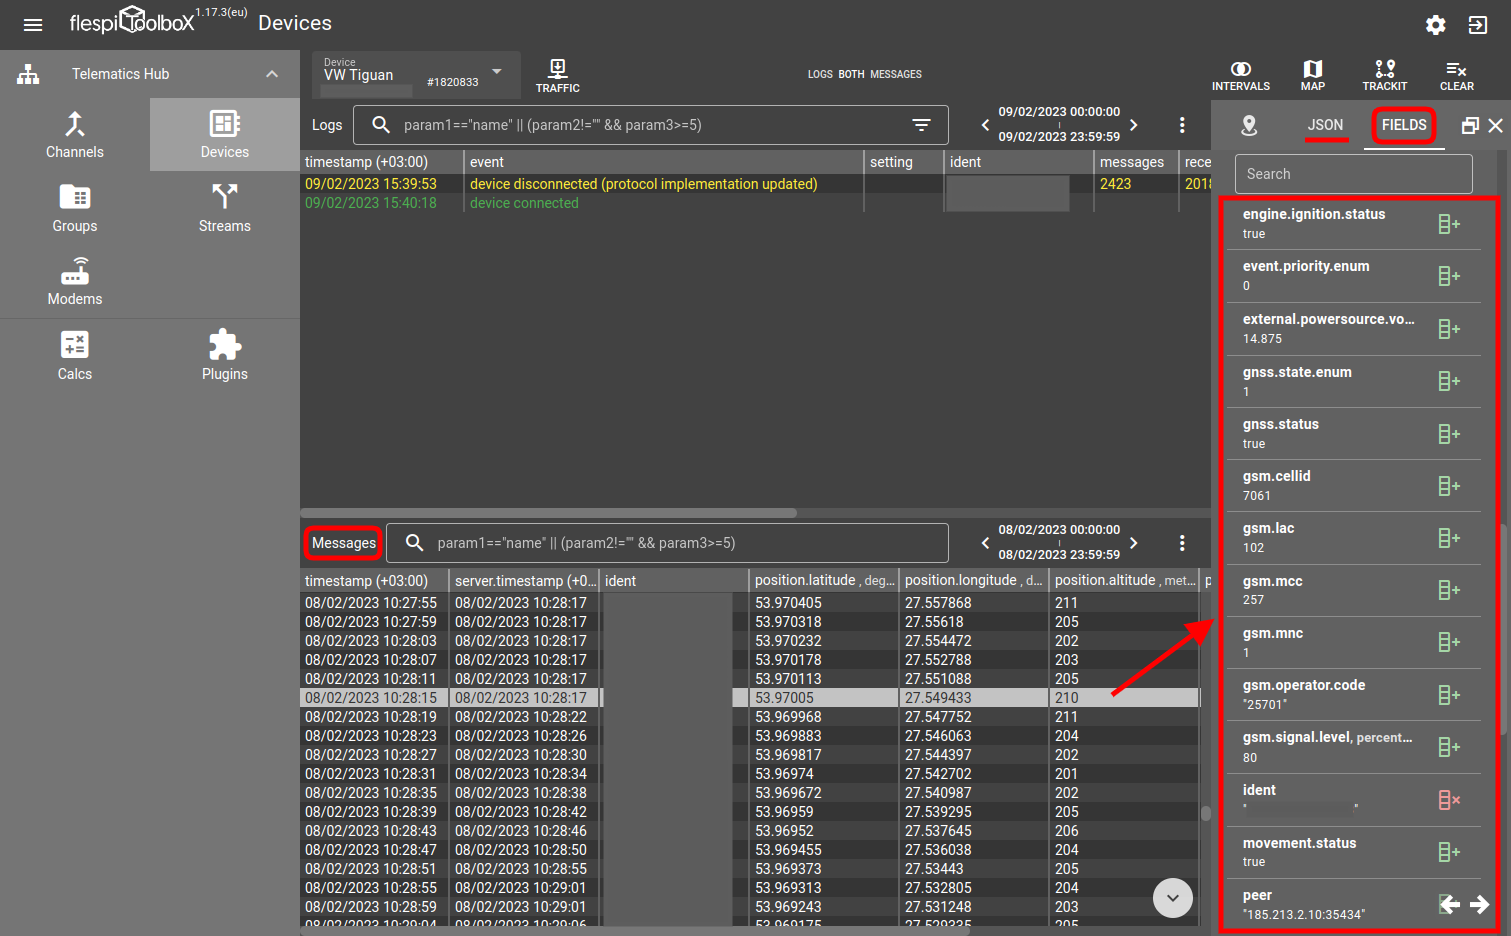
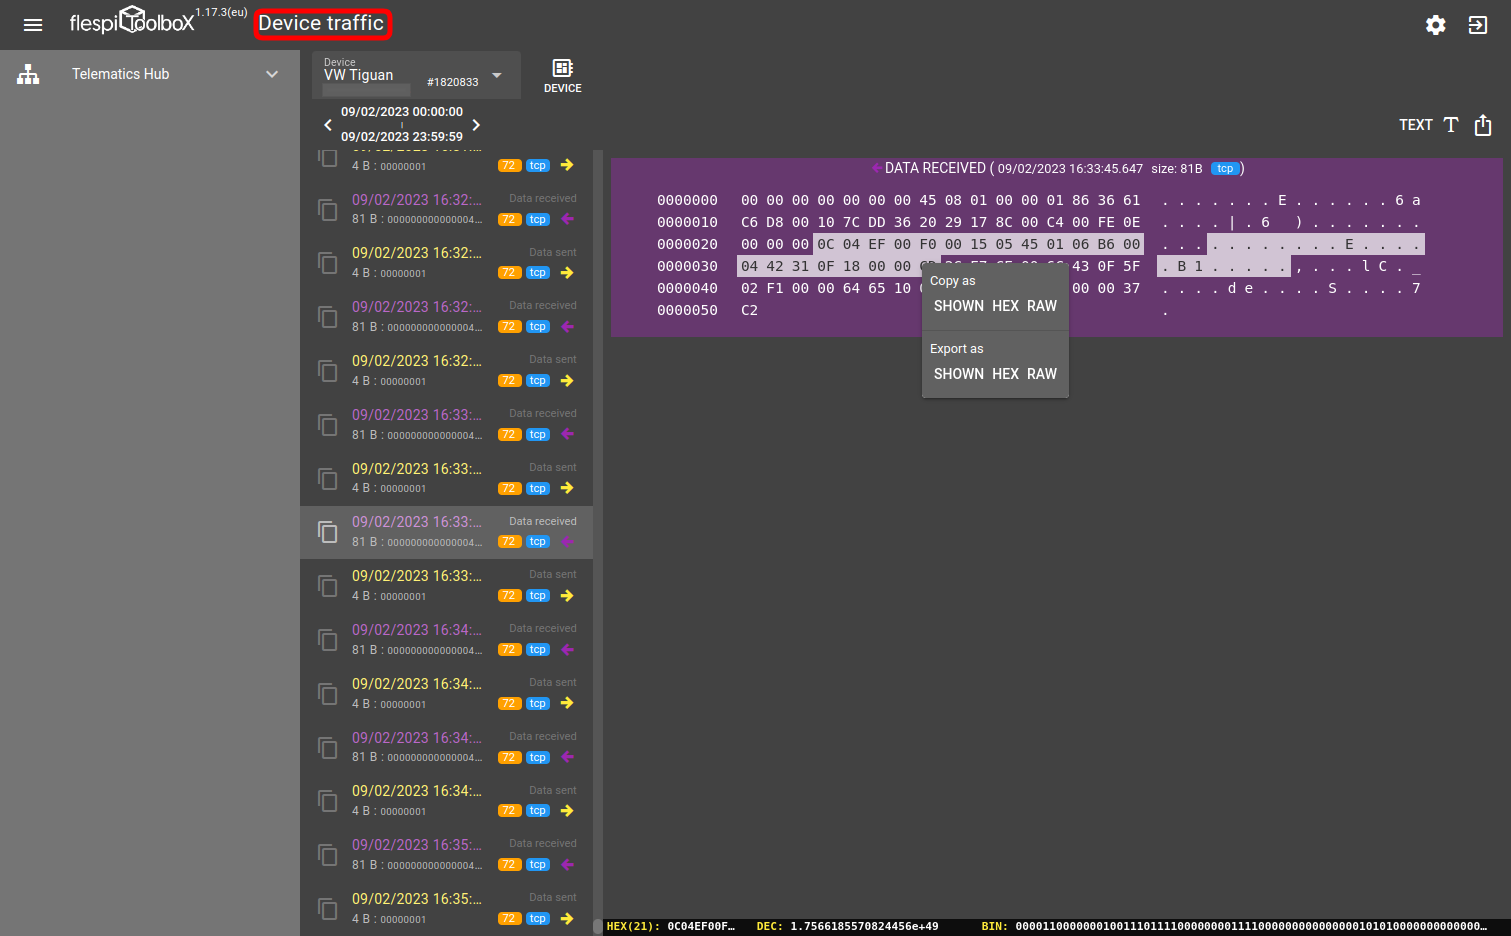
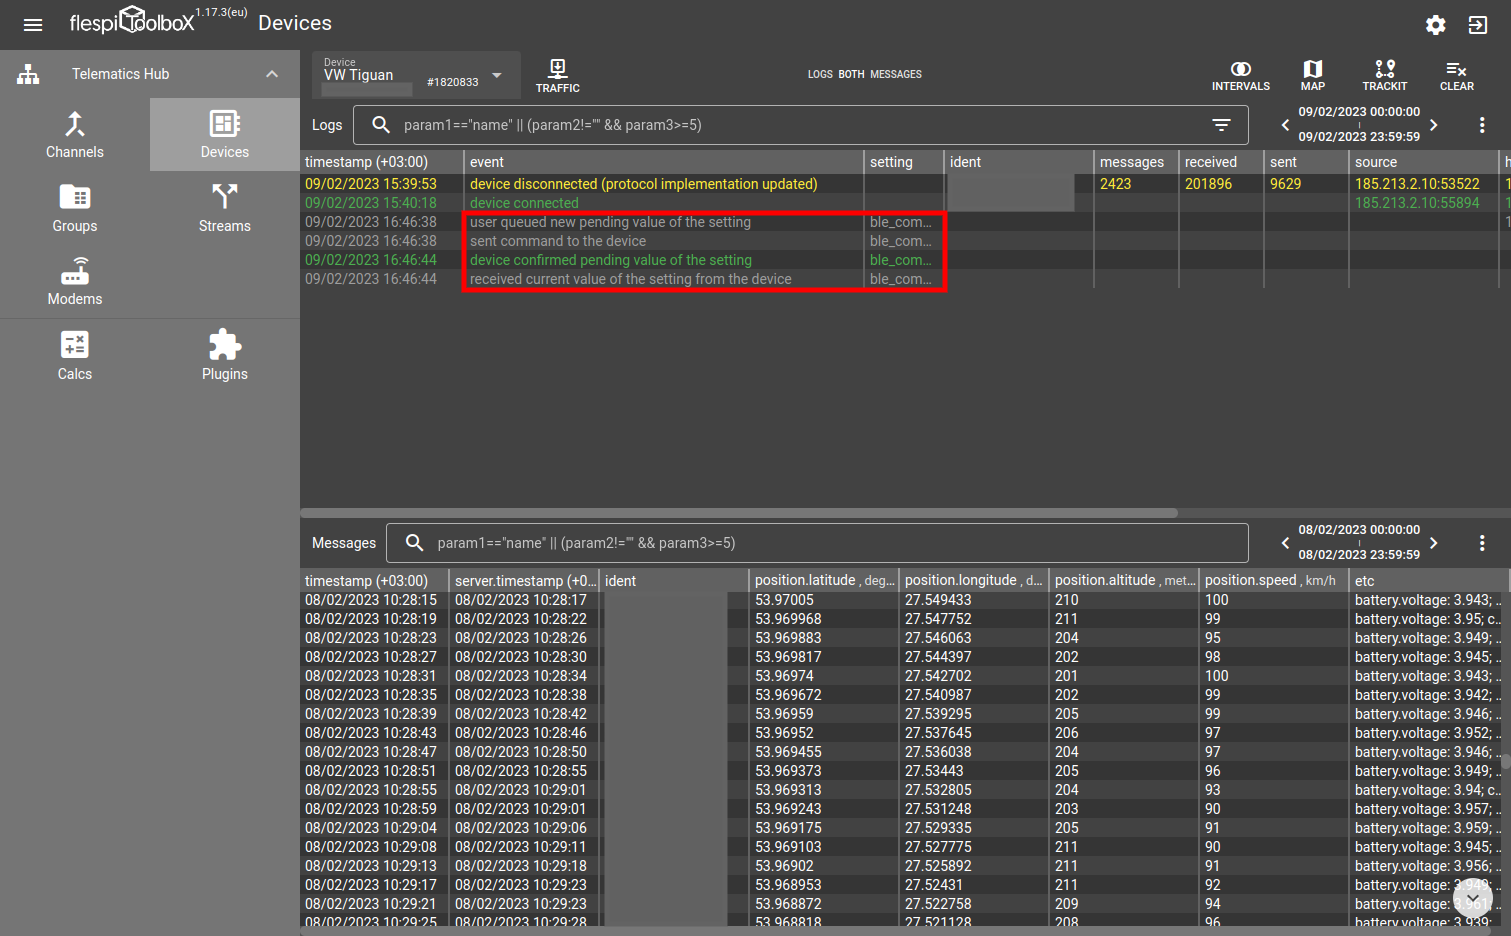
Pinpoint parsing errors, check commands status, monitor message flow, and stay in the know of every action and event on the flespi platform.
Introducing an app that lets you test the flespi platform without having a physical tracking device at hand.
A live demo of flespi AI integration: an AI agent receives a short onboarding brief, designs the architecture, creates every entity, validates the pipeline, and writes a provisioning script.
Now you can provide technical support for your devices directly on-site.