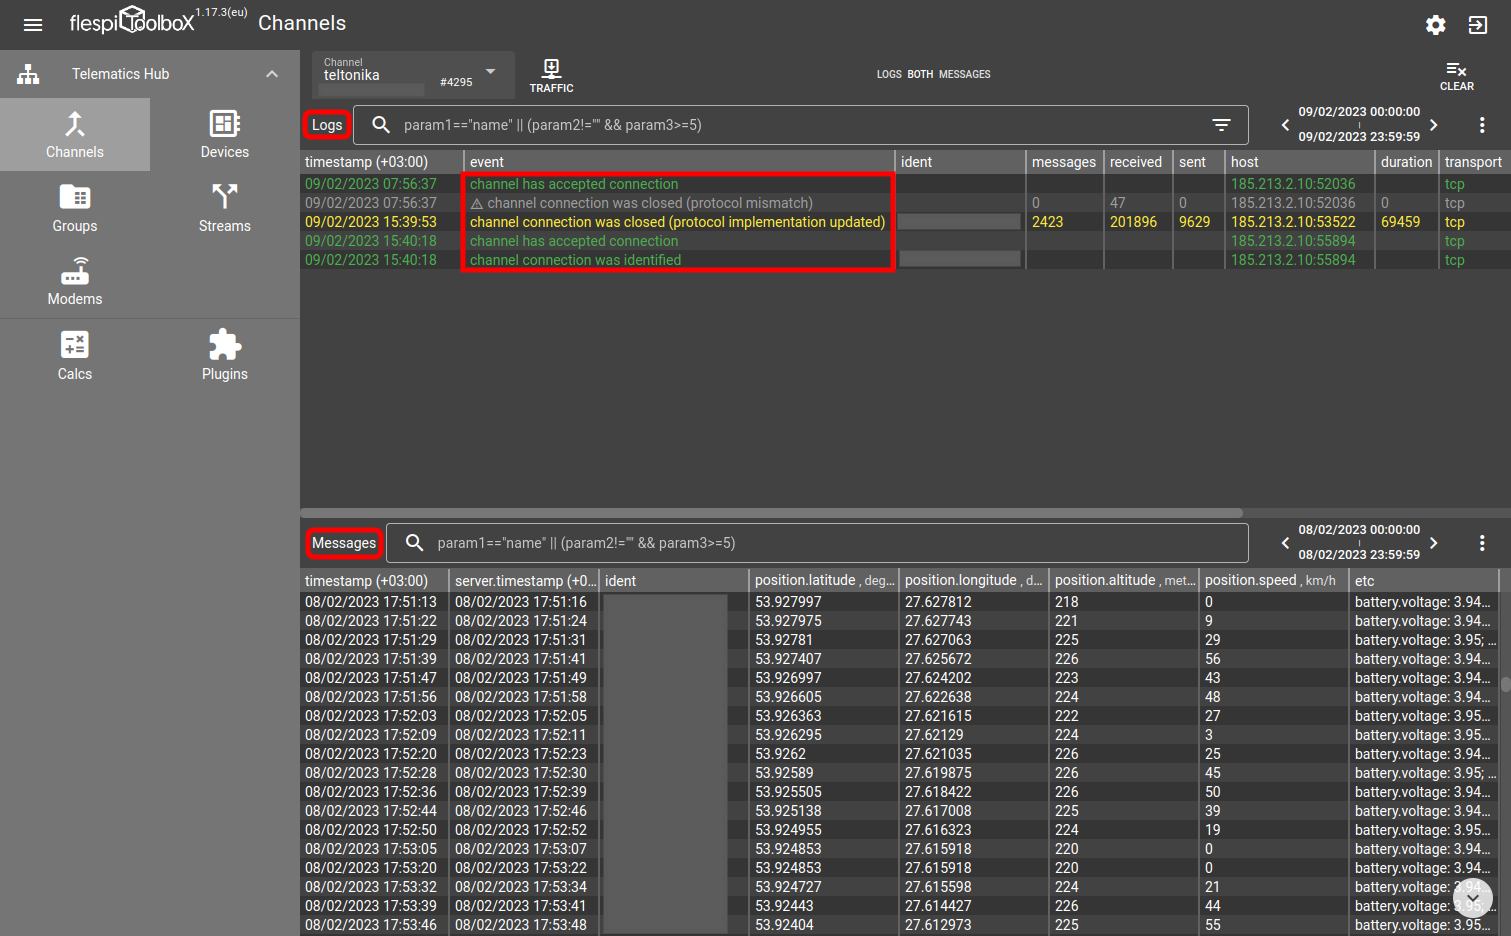
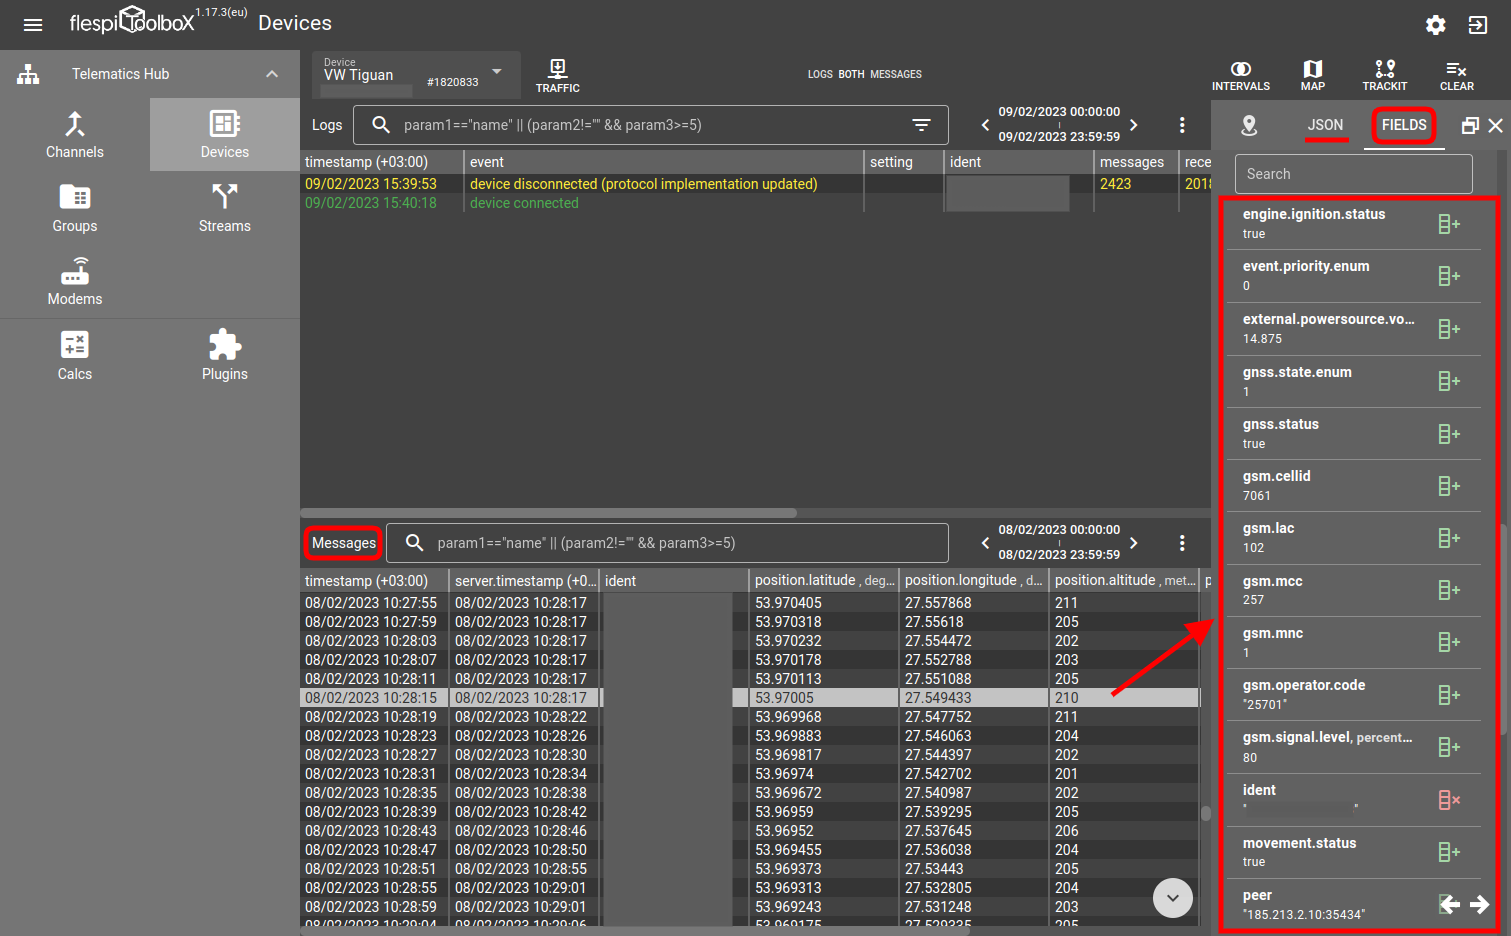
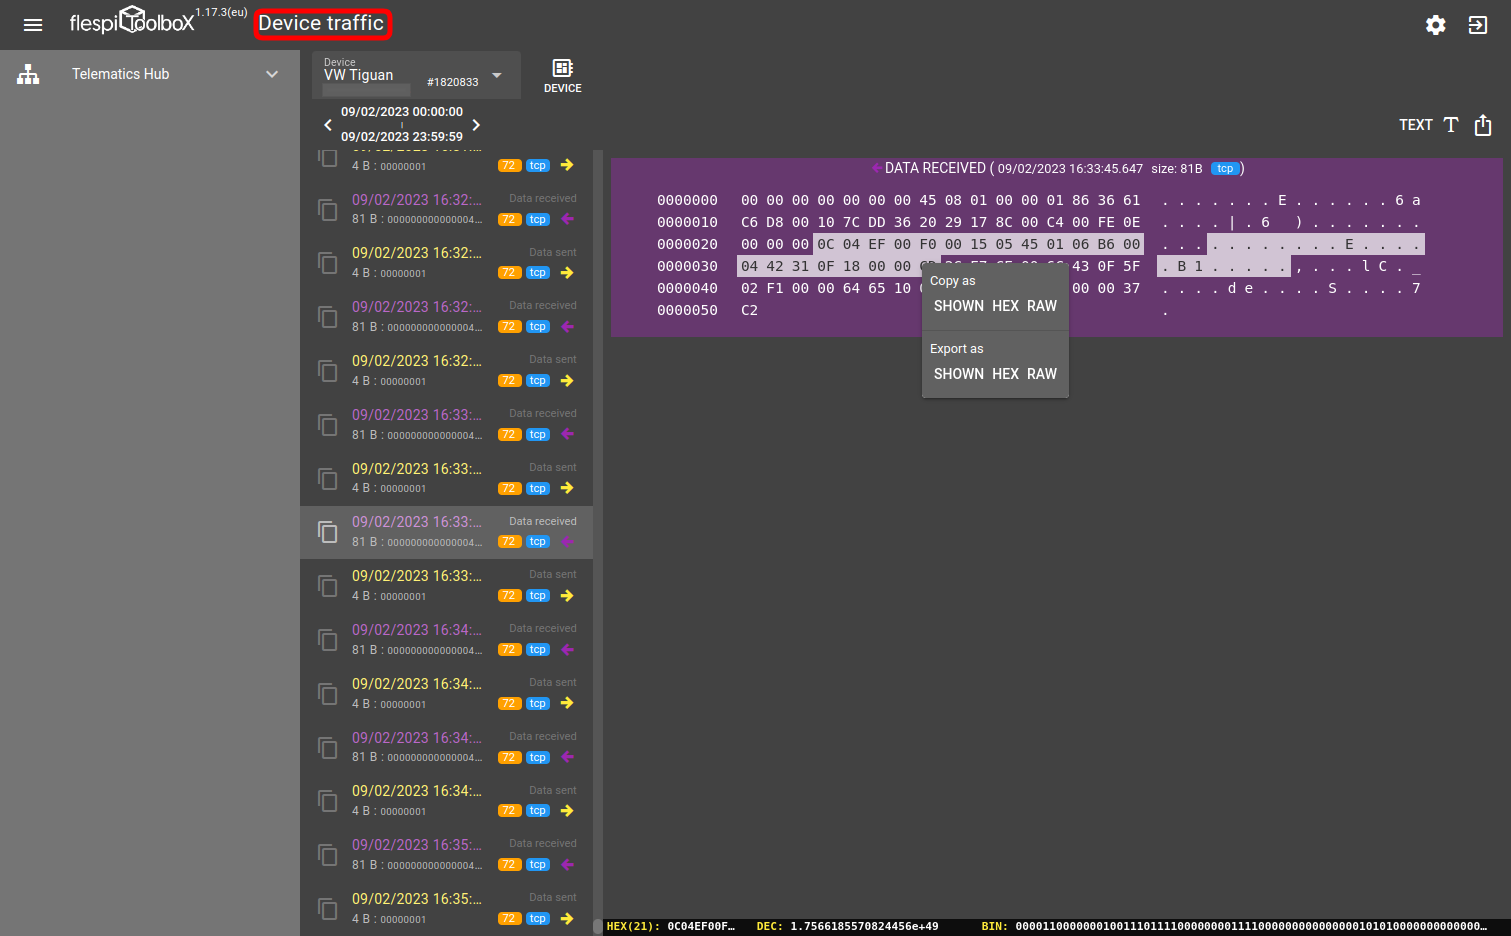
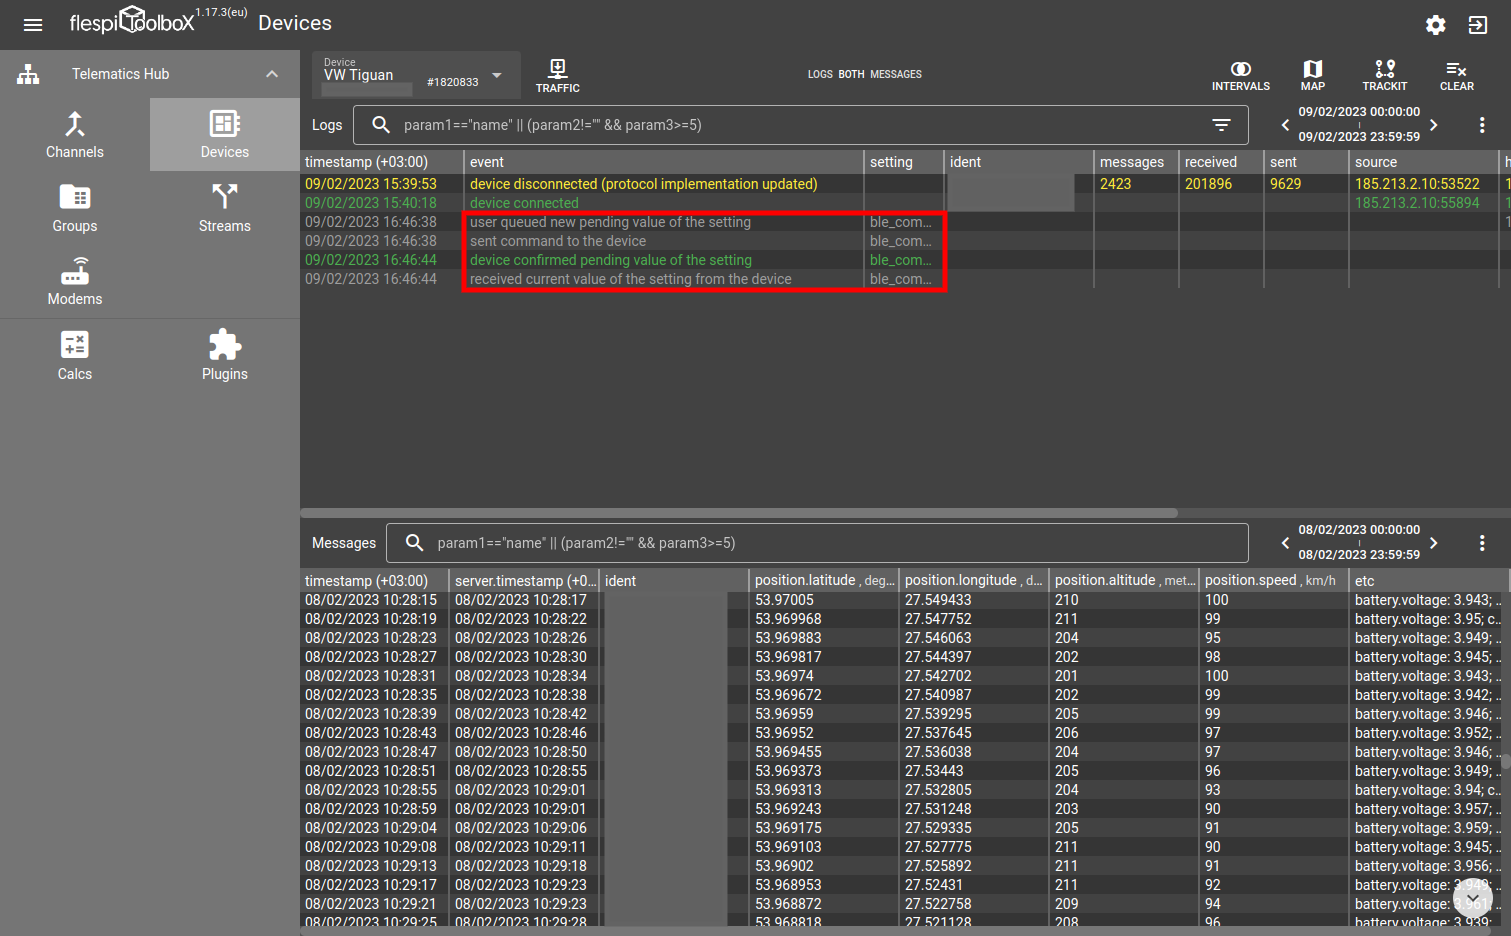
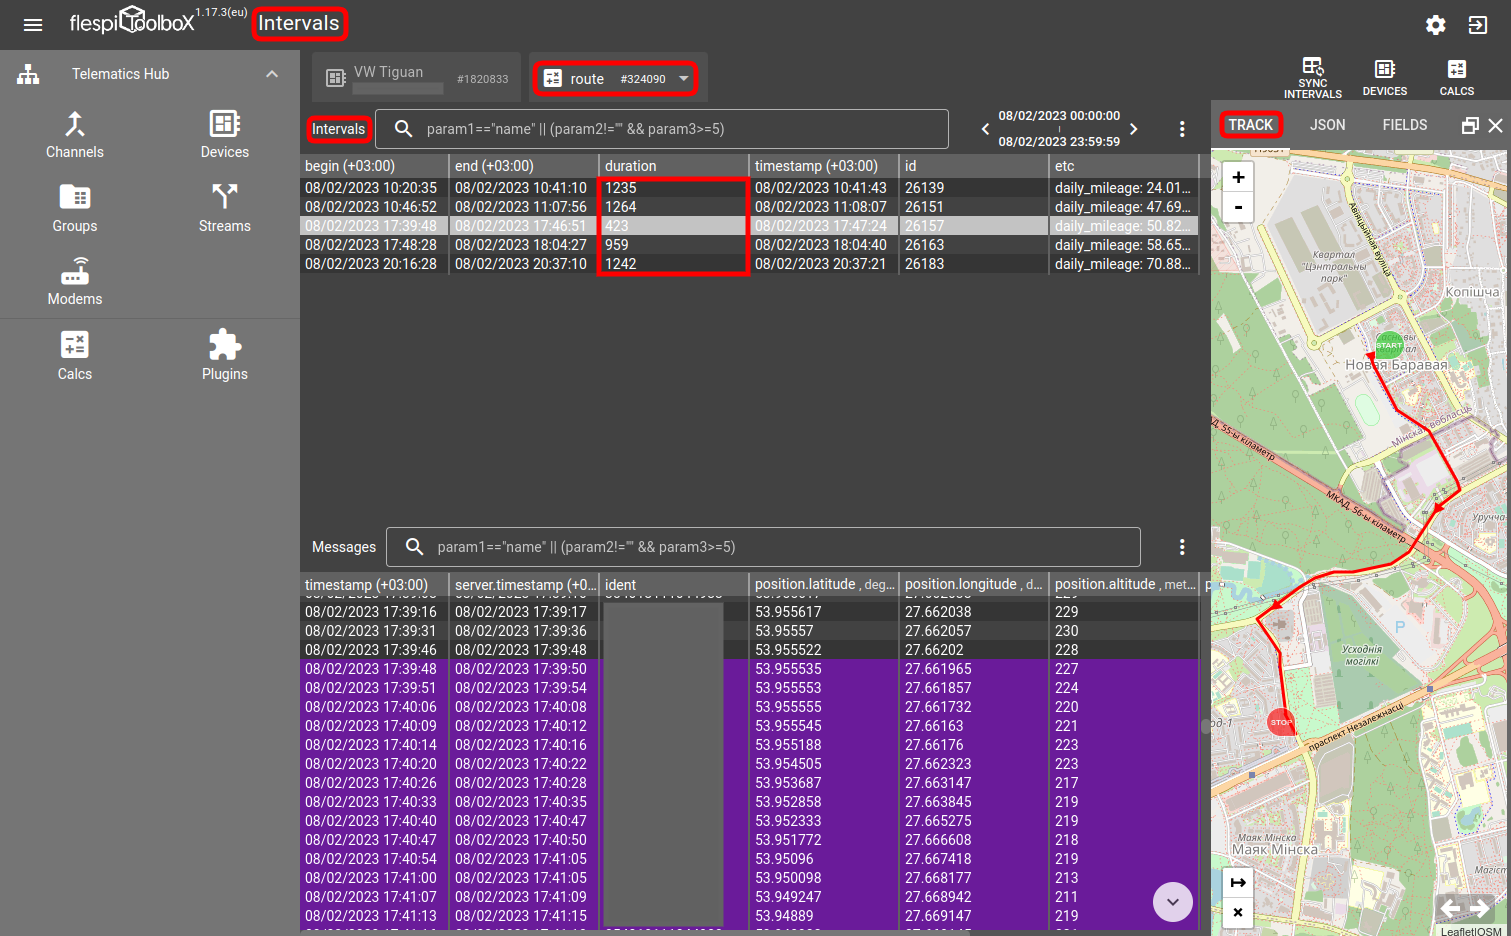
Open-source debug and diagnostics tool for all flespi platform entites — detailed logs, real-time messages, HEX traffic, and more. More details and screenshots in a dedicated article.
To stay in sync with the latest changes, subscribe to Toolbox changelog on our forum.
Debug your flespi-based infrastructure now. Run toolbox.flespi.io
Color-coded logs
Pay attention to the most critical records first. Intuitive color scheme makes the logs more verbose and helps you analyze them keeping calm and staying sane.
Quick filtering
Sift through the hundreds of log records and messages using flexible filters. Add logical comparisons ("duration>20"), find substring in a parameter value (“ident=*est*”), use wildcards to generalize search criteria, and combine several conditions using commas ("ident=*123*,duration>40").
Message details
See every single parameter of the incoming messages in a compact block. Copy message JSON in one click. Switch between Real-time and History modes to view messages and logs for the desired period of time.
Customizable interface
Choose which panes you want to see — logs, messages or both. Add/remove columns from the panes to see the data you need and hide the unwanted details.
Additional tools
Depending on the module of the flespi platform you are working with, Toolbox will have a slightly different look and features. For Telematics hub you also get the Traffic Viewer to analyze raw traffic for all channels and the HEX Viewer to sniff raw data in the proxy channel. For MQTT broker you also get the MQTT Board to experiment with MQTT pub/sub (including all MQTT 5.0 features), quickly see the outcome of your actions and logs.