Full throttle!
Is there anyone around who pushes the pedal to the metal to see what their car is capable of? I’m pretty sure there are quite a few of us — we are all excited about new technologies, learning about the latest and the greatest, and probing their potential. And it’s true for any technical product — after buying a desktop (or laptop) most of us run the benchmark first.
This is exactly what I decided to do with the flespi platform — test it under extreme load.
The flespi platform architecture is explained in detail by Aliaksei in a dedicated article. To cut the long story short, each internal component of the system is horizontally scalable, so the capability of the system to handle one or 100,000 simultaneous connections depends on the number of servers.
What I wanted to do is to measure the maximum volume of telematics data that flespi can handle within one TCP connection. Similarly to processors, systems have a single core and a multi-core performance. And it’s single core performance that shows how successful the processor architecture is.
The system I used for testing was my working laptop with the following specs:
- Ubuntu 18.10
- CPU E3-1505M v5
- 32Gb RAM
- 100Mbit, 50ms ping to flespi.io
Test scripts are written in LUA with asynchronous I/O. The protocol we picked for testing is Wialon IPS because the server responds with an ACK packet to each received telemetry message. This allows keeping the queue of 1,000 unacknowledged messages on the client side. The number of acknowledged messages per second will represent the performance of the flespi telematics hub.
Stage 1. Flespi channel performance
First, we will check the performance of the flespi channel when parsing the stream of messages. Here’s the client side log:
INF: 2019/02/19 09:58:10:908: [tcp] : 13713 msg/s
INF: 2019/02/19 09:58:11:931: [tcp] : 14040 msg/s
INF: 2019/02/19 09:58:12:934: [tcp] : 13866 msg/s
INF: 2019/02/19 09:58:13:937: [tcp] : 14501 msg/s
INF: 2019/02/19 09:58:14:949: [tcp] : 14355 msg/s
INF: 2019/02/19 09:58:15:951: [tcp] : 13718 msg/s
We get the performance of 14,000 messages per second for the Wialon IPS protocol. Channel log in Toolbox features very similar value. Let’s take this value as a baseline for further tests.

Stage 2. Data streaming performance
This part is about the flip side of the coin — forwarding the received data to third-party platforms.
Performance at this stage is no less important than for receiving data.
Since I am not aware of systems ready to receive a large data flow, I emulated the case in the following way:
Create a new Wialon Retranslator channel.
Create a new Wialon Retranslator stream and point it to another channel.
Subscribe the stream to the main Wialon IPS channel (used in Stage 1).
Forward the data flow.
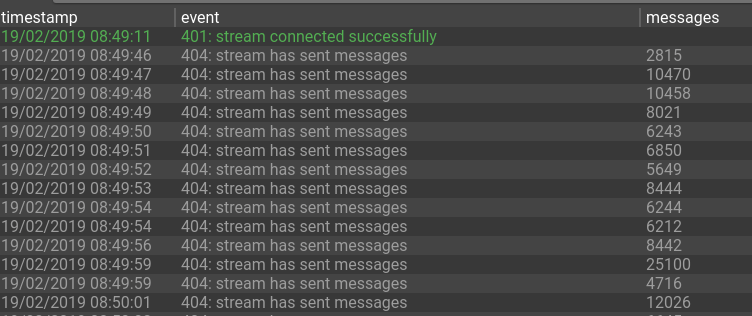
The goal of this test is to make sure the stream can handle the received data flow without delays and without excessive buffering. I believe, the fact that the sender and receiver are located within one network is negligible, since the toughest task for the stream is packing the data according to the protocol specification. The stream logs clearly indicate that the stream handles the load perfectly:
Stage 3. MQTT performance
Aside from streams, flespi also supports alternative ways of getting telematics data. One of such ways is connecting to the platform via MQTT protocol. Once connected, you can subscribe to channel messages and process the incoming messages. Here are the client logs for such operation:
INF: 2019/02/19 09:57:57:662: [mqtt] : 13814 msg/s, delay 0.047473s
INF: 2019/02/19 09:57:58:662: [mqtt] : 14399 msg/s, delay 0.045190s
INF: 2019/02/19 09:57:59:666: [mqtt] : 14802 msg/s, delay 0.045143s
INF: 2019/02/19 09:58:00:668: [mqtt] : 14657 msg/s, delay 0.044983s
Flespi MQTT broker effortlessly ensured messages delivery. Now let us clarify what the delay parameter means. Each message coming to the channel is marked with the timestamp parameter — the time when the message is registered in the system. The average delay value is around 45ms. Excluding the network delay of around 25ms, we get that the real delay between message arrival and its receipt via MQTT is 20ms.
Stage 4. REST API performance
All the tests above dealt with real-time data processing. However, many consumers of telematics data prefer requesting the data periodically via REST API. Let’s check how quick is the flespi platform in giving our the collected data.
We’ll forward the data to the channel and wait until it fills up a bit — 2GB should be enough:
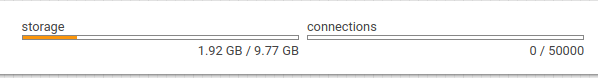
Now we will run the client to read the messages via REST requests. Each request reads no more than 100,000 messages in one go. The channel storage (1.92GB) was completely read in less than 10 minutes:
INF: 2019/02/19 10:36:40:807: [http] : 17273.316823 msg/s
INF: 2019/02/19 10:36:48:166: [http] : 16156.016661 msg/s
INF: 2019/02/19 10:36:56:000: [http] : 16107.057544 msg/s
....
INF: 2019/02/19 10:45:03:498: [http] : 16464.478887 msg/s
INF: 2019/02/19 10:45:10:291: [http] : 17197.204627 msg/s
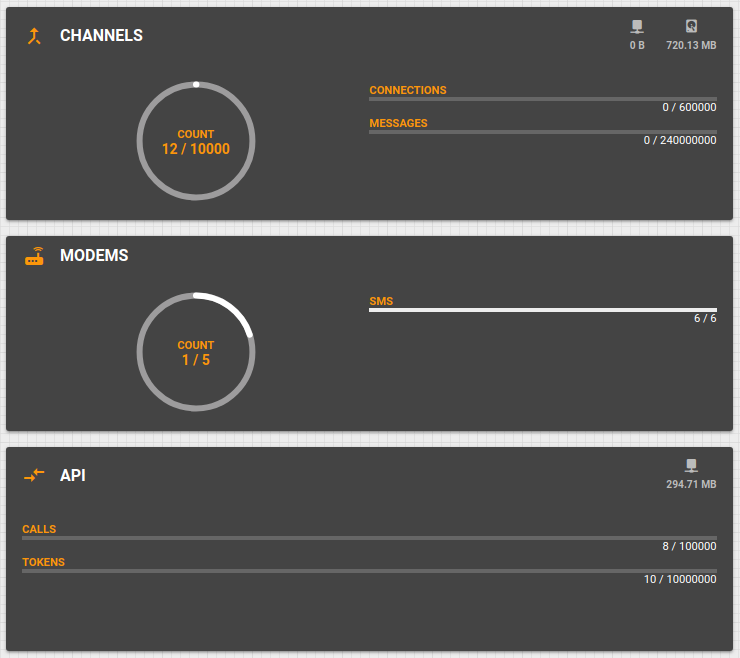
During the reading process, the API traffic reached around 300 MB per minute, which exceeds the traffic limit of 200 MB per minute for the Free account but is way below the limit of 2 GB per minute for the Commercial accounts.
Final thoughts
This brief yet comprehensive testing proves the absence of any internal bottlenecks in all scenarios of flespi platform usage. Telematics hub, MQTT broker, and storage system all operate coherently letting the user implement projects of any complexity and any scale with the highest performance requirements.