One of the common tasks is to calculate the number of messages reported by devices per day, week, or month to understand which devices contribute the most to your channel performance or to the growing volume of your storage bill.
This task is easy to solve with flespi calculators.
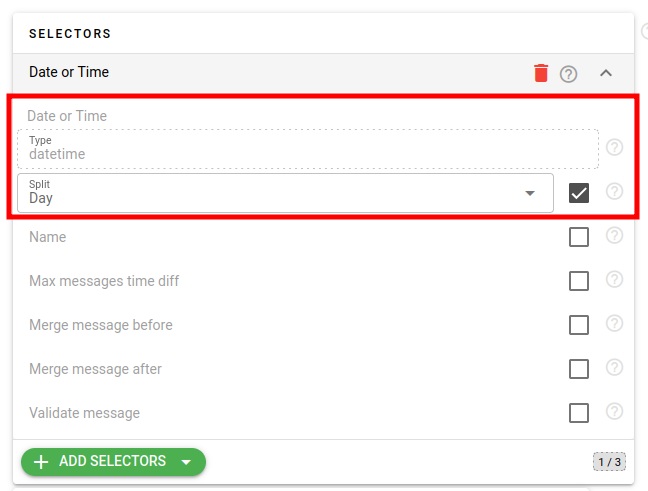
In the calculator configuration, you specify the datetime selector and select the correct split interval - the basis on which to calculate the device messages stats. For example, to have daily per-device message stats, you will specify "split by day" in this field:
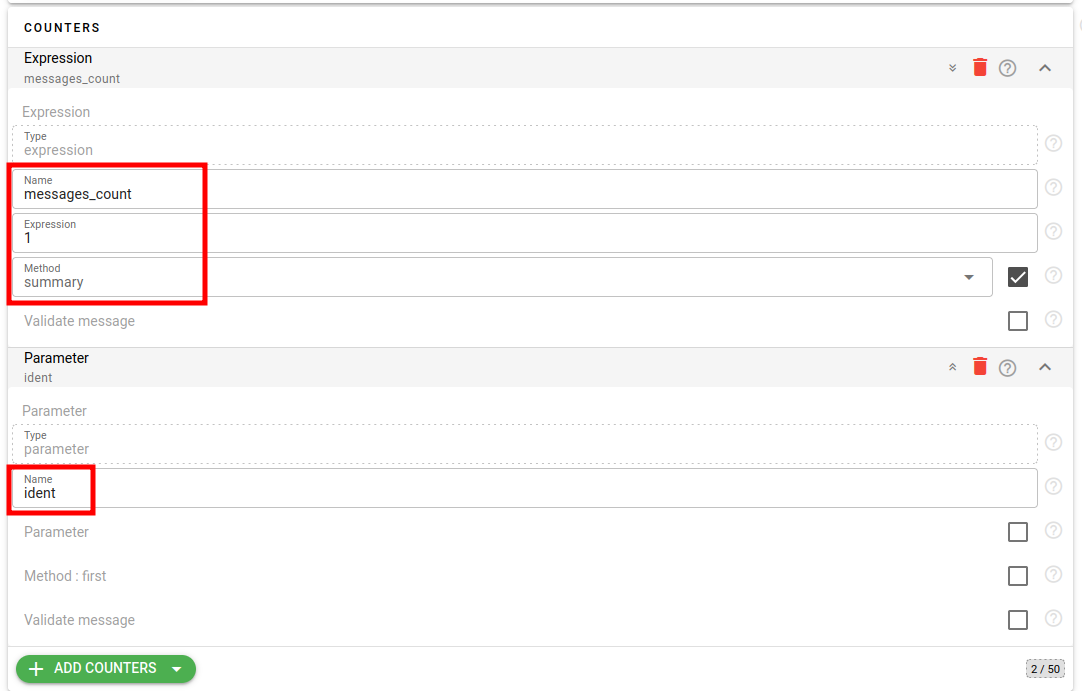
To calculate the total message count per interval, you add a simple counter of type='expression' with expression='1' and method='summary' to add up all messages for the day. In order to understand the device from which this interval is, you also add a counter of type='parameter' with name='ident' (you can add also 'device.id' or 'device.name' counters if identification by ID or name is preferable):
You may also add more counters if interested in some additional daily statistics for the device - for example, you may add a counter to calculate daily mileage, average speed, fuel consumption, and so on - everything depending on your needs and data available in device messages. You can enrich device messages with traffic volume by using webhooks that will repost connection statistics into device messages and after that add a counter to calculate per-device daily traffic.
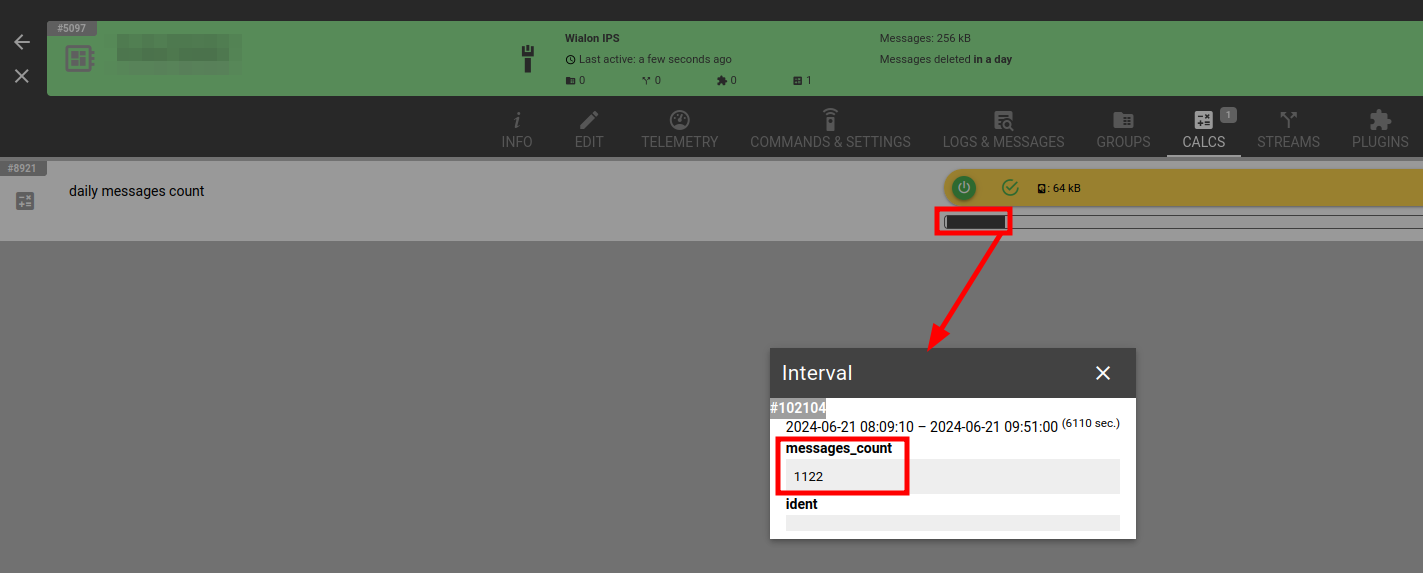
Once you create the calculator, assign devices to it, wait a bit until all intervals are calculated and synchronized, and after that, you may access calculated daily statistics. You can access the latest daily statistics for the current day for each device from its CALCS tab by clicking on the black small rectangle on the timeline visible on the calculator's card:
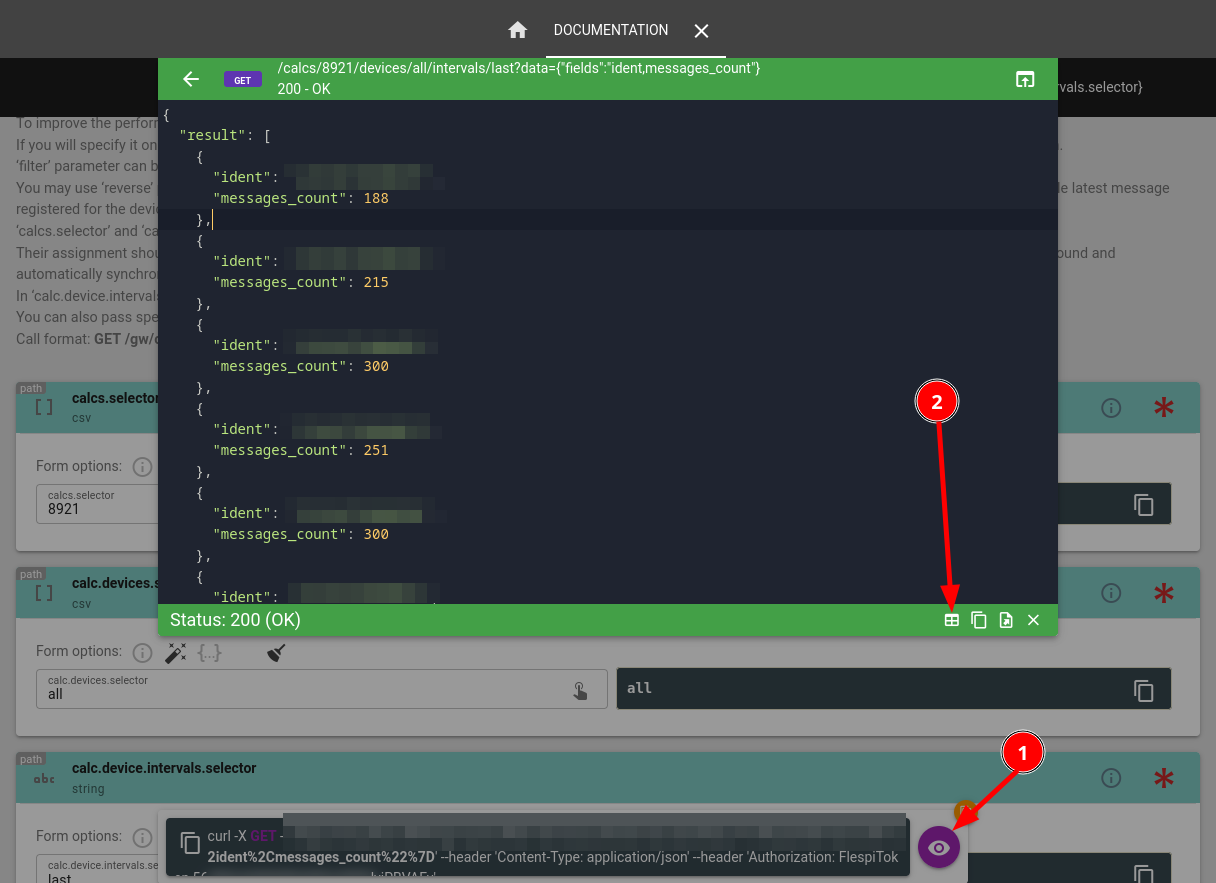
Alternatively, if you want to analyze devices in batch and compare which devices contribute the most to your channel performance (for example, if it is periodically blocked by message frequency), you can use ApiBox to show and sort the output of the REST API call result. You can do this by opening the next link, just do not forget to authorize into ApiBox by clicking login in the top-right corner and specify the correct ID for your calculator. In the link, we configured API call parameters to retrieve 'ident' and 'messages_count' fields for all 'last' intervals from 'all' devices assigned to the calculator. You just need to specify a calculator ID. Click on the 'eye' button to run the API call and you will receive the following output:
{
  "result": [
    {
      "ident": "<ident1>",
      "messages_count": 188
    },
    {
      "ident": "<ident2>",
      "messages_count": 215
    },
    …
  ]
}
After that, you may click on the table sign in the right-bottom corner of the popup window with the output of the REST API call result to switch to the table view:
And click now on the 'messages_count' column header to order by the most frequently reporting devices:
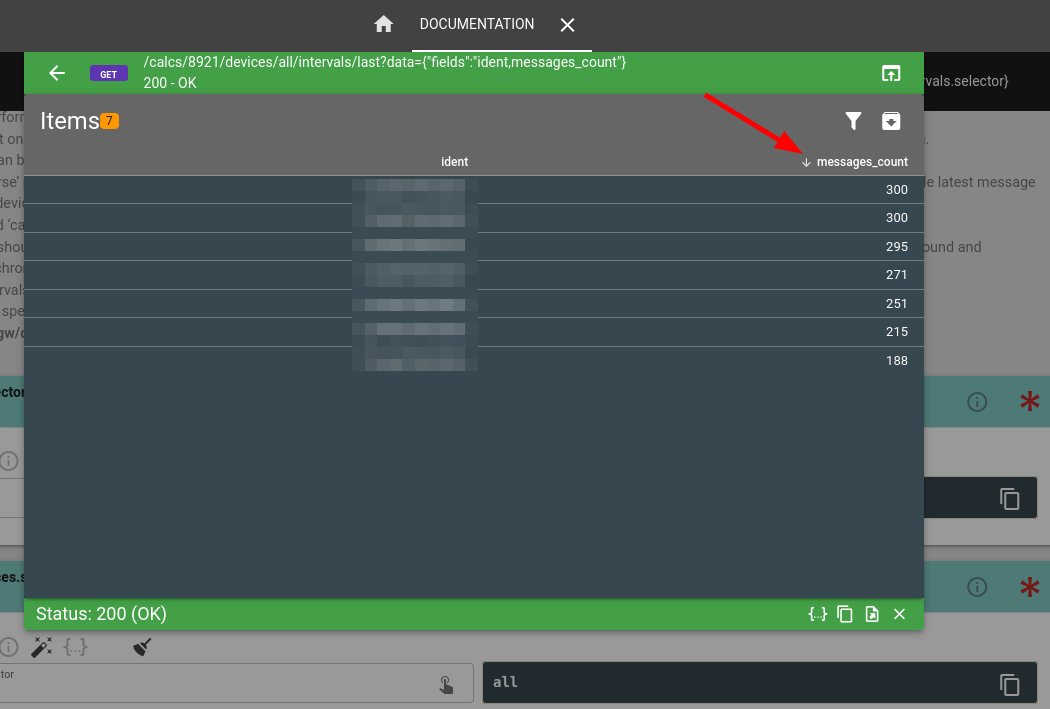
Now you can export this table in CSV format to load into a spreadsheet of your choice, if desired.
P.S. You can easily aggregate intervals for multiple days or analyze different time range by specifying ‘all’ in the calc.device.intervals.selector instead of ‘last’ and timestamps of your choice in the ‘begin’ and ‘end’ fields inside the REST API call ‘data’ section.