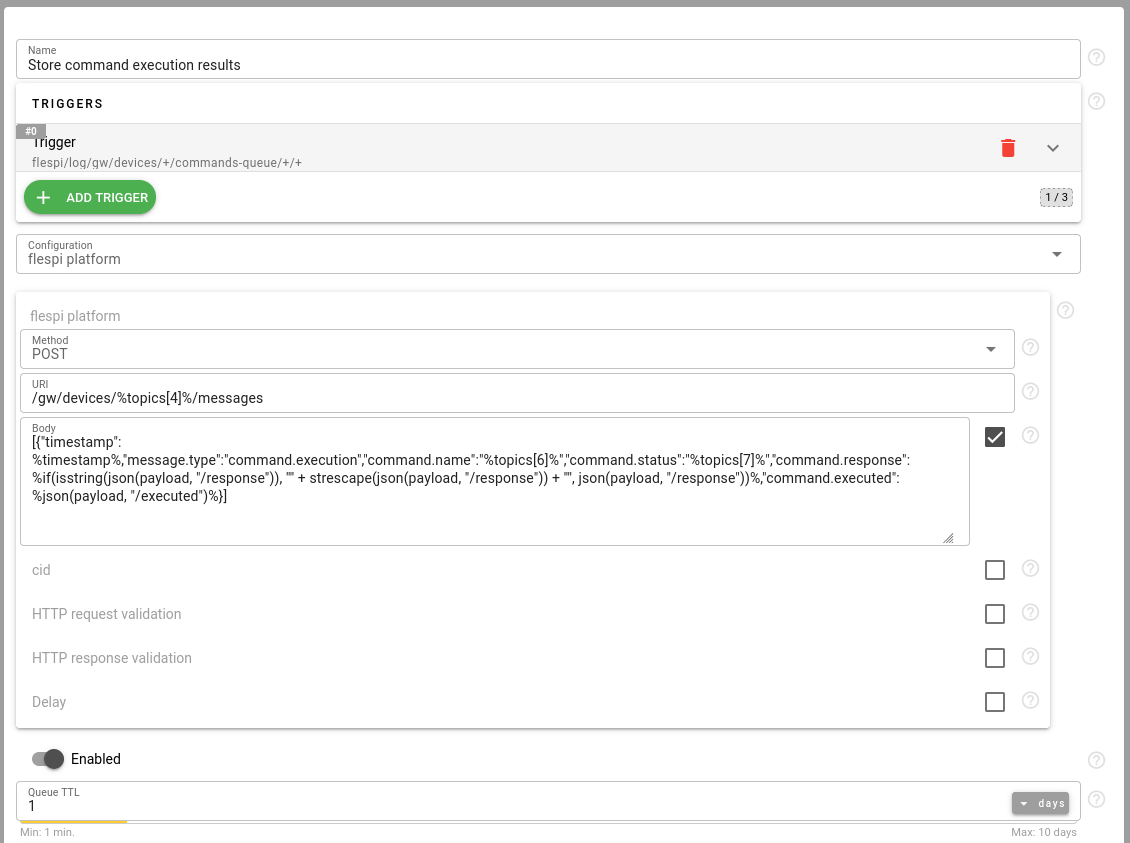
This article explains how to automatically store device command execution results in device messages. This approach can be useful for:
Maintaining a complete history of device remote management activity
Analyzing command execution patterns and success rates
Integrating command execution logs into your reporting system
Accessing command execution history via standard message processing tools (plugins, calculators)
Forwarding command execution logs via streams subscribed to the device
We will use a webhook to catch command execution logs and store them as device messages. The webhook will:
Listen to command execution logs
Format log data into a message
Post this message back to the device
Configuration
Create a new webhook with the following configuration:

{
    "name": "Store command execution results",
    "triggers": [
        {
            "topic": "flespi/log/gw/devices/+/commands-queue/+/+"
        }
    ],
    "configuration": {
        "type": "flespi-platform",
        "method": "POST",
        "uri": "/gw/devices/%topics[4]%/messages",
        "body": "[{\"timestamp\":%timestamp%,\"message.type\":\"command.execution\",\"command.name\":\"%topics[6]%\",\"command.status\":\"%topics[7]%\",\"command.response\":%if(isstring(json(payload, \"/response\")), '\"' + strescape(json(payload, \"/response\")) + '\"', json(payload, \"/response\"))%,\"command.executed\":%json(payload, \"/executed\")%}]"
    }
}
The configuration explained:
Trigger topic flespi/log/gw/devices/+/commands-queue/+/+ catches all command execution logs
URI /gw/devices/%topics[4]%/messages posts message to the device that executed the command
Message contains:
message.type - identifies message as command execution log
command.name - name of executed command
command.status - execution status (processed, queued, sent, canceled, expired)
command.response - command execution response (if available)
command.executed - command execution result (if available)
Usage
Create webhook with the configuration above
Execute any command on your device
Command execution result will be automatically stored as a device message
The device message will look like:
{
    "timestamp": 1621234567,
    "message.type": "command.execution",
    "command.name": "custom",
    "command.status": "processed",
    "command.response": "OK",
    "command.executed": true,
    "rest.timestamp": 1621234568
}
For each queued and successfully executed command you will receive 3 messages: queued, sent, processed. You may limit this to just processed commands by using "flespi/log/gw/devices/+/commands-queue/+/processed" topic in webhook configuration.
You can access these messages via:
REST API - to fetch command execution history
MQTT API - to receive real-time command execution logs
Streams - to forward command execution logs to external platforms
Plugins - to process or analyze command execution patterns
Calculators - to generate reports on command execution statistics
Examples
Here are some examples of how you can use command execution messages:
Calculate daily command execution statistics using calculator:
"counters": [
{
    "type": "expression",
    "name": "commands_total",
    "expression": "message.type == 'command.execution'",
    "method": "summary"
}
]
Forward only successful command executions using stream:
{
    "validate_message": "message.type == 'command.execution' && command.executed == true"
}
Filter command execution messages in REST API:
GET /gw/devices/{device-id}/messages?data={"filter":"message.type=='command.execution'"}This way you can maintain a complete history of device remote management activity and integrate it into your reporting and analysis workflows.