Every respectful product should have a public status page.
Especially the one that provides service 24/7/365 over the Internet.
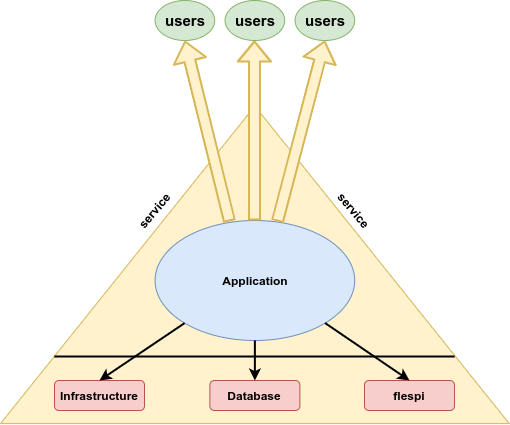
Especially the one which, like flespi, is located at the bottom of any product supplier's pyramid and which uptime defines the lowest uptime of the product built on top of it.
That’s why we take the flespi uptime very seriously and calculate it as precisely as we can. We are absolutely open in this respect and share flespi uptime for each month in our monthly changelog articles with all historical records available on the special status page.
How we calculate platform uptime
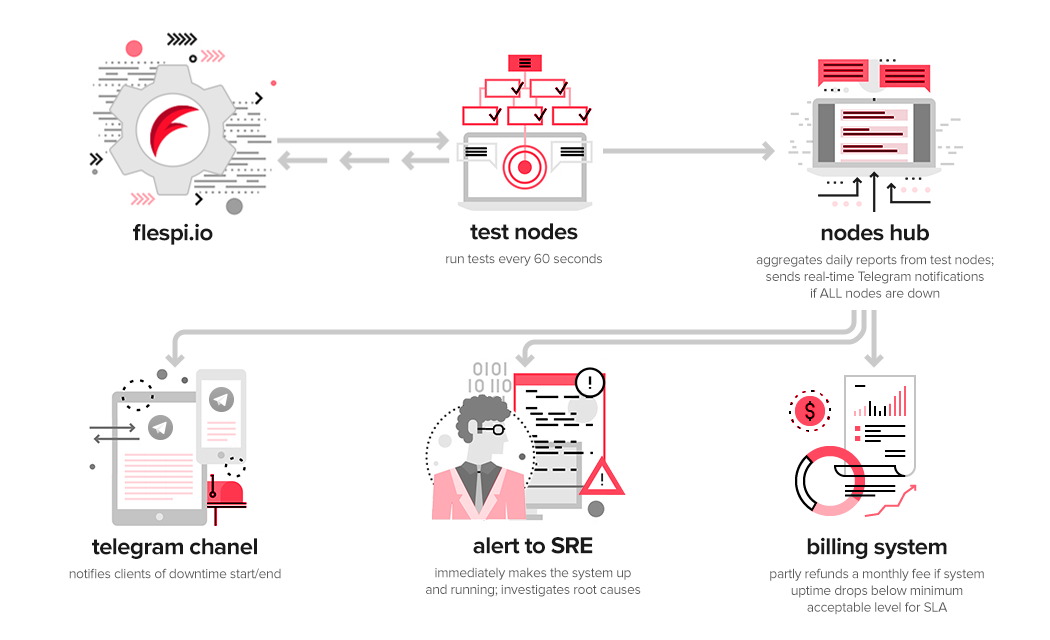
How we calculate our uptime is described in this wonderful article dated June 2017 and not much has changed since that time except that we enhanced the range and quantity of tests we perform every minute. Now it is 14 tests checking the functionality of REST API, MQTT Broker throughput, storage system performance, telematics gateway TCP stream handling and parsing capabilities, and PostgreSQL database server meta-data operations performance. We are still controlling that each test takes no more than five seconds to complete and that all 14 tests are completed within 10 seconds.
If any of the tests fail or timeout, we re-run all 14 tests and in case we are still experiencing issues, we indicate the beginning of the downtime for the node on which tests are being performed and report it to our special hub that accumulates current flespi platform status from all nodes. Starting from that time we try to re-run tests every 10 seconds. Once all tests are completed successfully and in time we indicate the end of the downtime and report this information again to the hub.
This special hub forwards such events to our special SRE chat in Telegram where all information from various tools/systems is collected, we then discuss the flespi state with the team no matter when it happens and where the team members are located at that moment, and take appropriate actions immediately.
This hub controls how many nodes are in the downtime state at the moment and automatically declares the whole flespi platform downtime if the situation is bad globally. When the flespi platform global downtime is declared, it is also automatically reported to the NOC (separate Telegram channels for EU and RU) where not only our engineers but all flespi users can see it.
What has also changed compared to 2017 is the number of nodes from which we are running tests and the criteria for the global flespi platform downtime declaration.
Initially, we had only the EU region, which heart is located in the Netherlands (Groningen). External nodes were located in the Netherlands (Amsterdam), Russia (Moscow), and Canada (Montreal) for overseas checks. Currently, this list is much longer and we monitor flespi availability from 12+1 locations all over the world:
Europe
Netherlands (Groningen)
Netherlands (Amsterdam)
Germany (Frankfurt)
Great Britain (London)
Sweden (Stockholm)
Russia (Moscow) x2 locations
North and South America
USA West (California)
USA East (Ohio)
Brazil (São Paulo)
Africa
South Africa (Cape Town)
Asia/Pacific
India (Mumbai)
Singapore
Our special hub automatically declares and counts global flespi platform downtime when 50% of these nodes report downtime. It means that if we have some kind of network problems on the path from one location to flespi, we can see it in our SRE system but the global flespi platform status will be up and running.
What was missing and how we fixed it
If your application that depends on flespi is located in the AWS us-west-1 region and there is a problem at the moment somewhere on the path from California to the Netherlands and from all or most of other locations flespi is correctly accessible, there will be no downtime indication in flespi NOC and you won’t know what is going on.
The status will be: flespi is OK for everybody except for your application. Well, this can be a bad situation. I believe you don’t really care about everybody. What you really need is an indication of how flespi is currently available from your particular location.
In order to resolve this issue and provide even more transparency to the flespi operation, we decided to enhance our test nodes with an extra feature. Each test node in each location establishes an MQTT connection to the flespi MQTT broker, subscribes to the appropriate topic, and each 5 seconds measures round trip time for the published MQTT message. Basically, this is the test of the current network status plus some basic tests of the MQTT Broker performance.
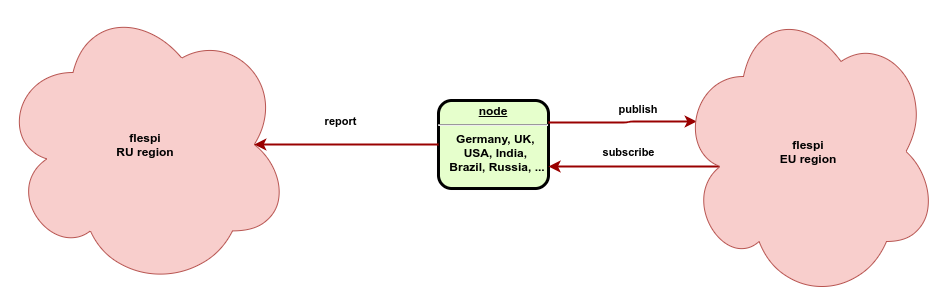
Each node’s path latency is measured every five seconds and results are reported in real-time to another flespi region for storage and further processing. If the published packet is not received back within five seconds, we mark this location as inaccessible. As you may have already noticed, all our special applications — be it COVID19 transportation industry effect visualization or Counter-Strike game controlling system, and a lot of other small tools — are built on flespi using REST API and MQTT HASD capabilities with efficient usage of analytics for automatic calculations. The only important thing here is that we are measuring metrics of one flespi region (for example EU) and report results to another flespi region (for example RU). This is to ensure that even if a region is totally down due to network issues, you can still see this by sourcing current status information from another region.
Update: as we decided to shutdown RU region due to the war in the Ukraine now the network health data is stored in the same region as being analyzed. It means when our network is totally down you won't have fresh information on that page.
And in order to visualize this on a beautiful map, we created another flespi application that is located on a third-party hosting. This application is available under the link https://status.flespi.io (please bookmark it) with region selector or direct links for the EU region and for the RU region:
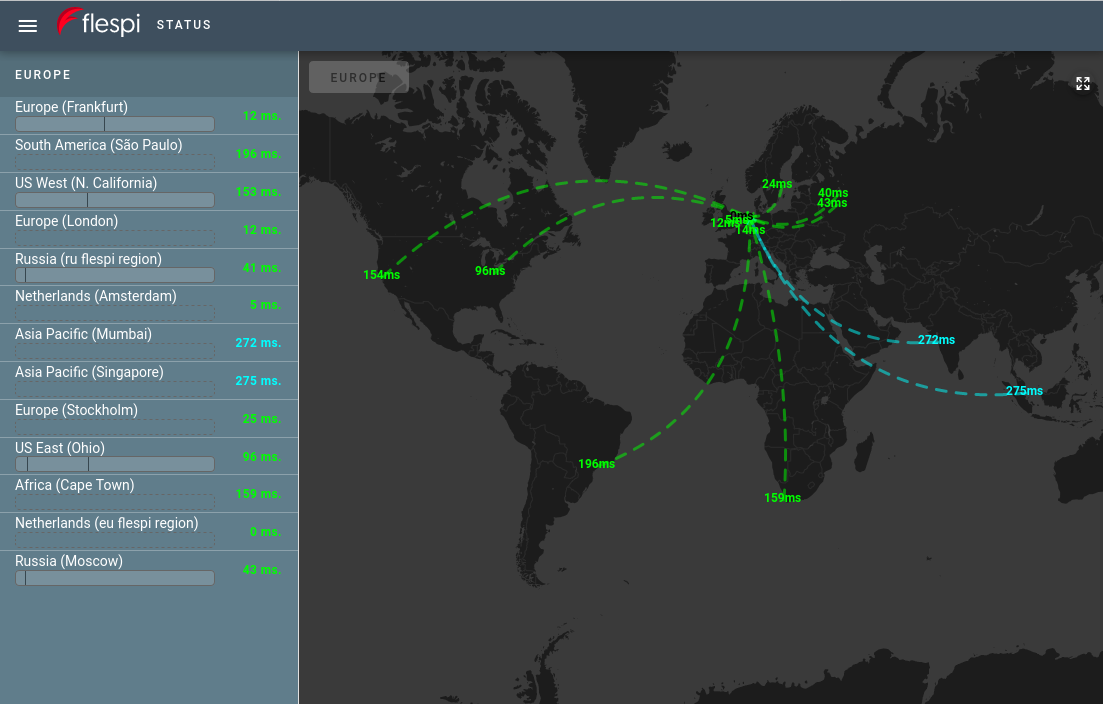
Under each node (location) you can notice a horizontal bar that shows the history of issues with flespi from each particular location for the last 24 hours calculated by flespi analytics in real-time. This is not downtime in that location but network status history — we monitor time intervals when an MQTT message published to the flespi MQTT Broker from this location wasn’t received back on the same node within five seconds.
We are open so that you can be confident
We track and report our monthly uptime since July 2018. If you look at the red vertical bars on the status page, you will notice that since March 2020 they show stable high values. The same is true for the blue vertical bars that show the same metric for our second region (Russia). It does not mean that the COVID19 virus made its way to our Netherlands datacenter or that we changed the way we calculate uptime. It is just a coincidence with the beginning of the global pandemic and our launch of the RU region, which was discussed in September of 2019 when nobody expected what would happen to the world in the following months.
What actually happened is the completion of changes to the network infrastructure implemented by our uplink provider and the completion of adaptation of the flespi platform to operate in multiple regions. Once the network was changed and our platform adapted to the new operation mode, all failures that happened to us and affected the resulting flespi uptime were minor and short-term.
After stabilizing the network infrastructure we realize that now the changes we do to the platform will affect the uptime most. Any change is difficult — if we change an internal system, from the outside it looks like we did nothing; if we change the API, it requires efficient coordination with our users in order to introduce it and not break their applications. But we also know that any further development involves changes. In our competitive and rapidly changing world, you can stay ahead only by doing preliminary changes in the right direction by predicting what will happen in the future.
We have done a lot of changes, we do a lot of them each day and I promise we will continue doing them in the future to make flespi better, quicker, and more reliable!
P.S. The network status map is also available from the platform status page.