Analytics system is a flexible report and notification engine to which you can offload:
Reports calculation based on the data in device messages - e.g. to extract from device messages trips or rides, geofences exits/entrances, calculate their properties such as mileage, duration, maximum speed reached and so on.
Receive notifications about certain events happening to devices - such as trip or ride started or stopped, geofence entered or exited, door opened or closed, DTC error code appeared, parked for more than 10 minutes with engine running and so on.
Calculation and registration of specific parameters not natively reported by the device - e.g. current trip duration or mileage, time spent in geofence, current total daily driving time and so on.
Storage and quick access to the calculated device data for up to 10 years in a compact format.
To start you may watch an analytics overview video from our conference or check different analytics use cases in our KB.
Essentials
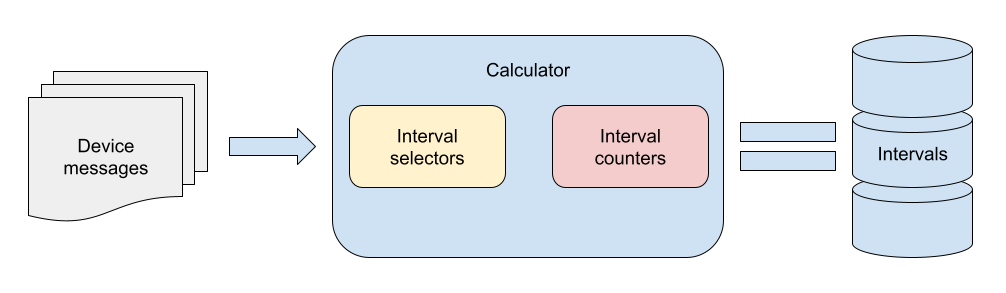
The main goal of flespi analytics is to aggregate incoming messages into intervals based on specific (user-defined) logic, provide efficient persistent storage for them and generate various MQTT events upon any change.
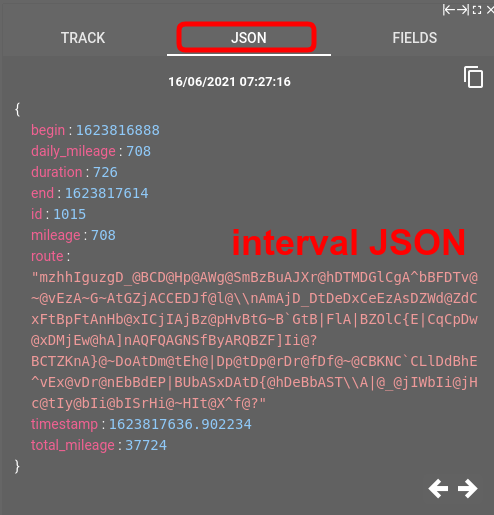
Interval is a JSON object. "begin", "end", "duration", "id" and "timestamp" fields are added to the interval automatically and all other interval fields are defined by the counters in the calculator configuration.
Calculator defines the configuration and rules of messages aggregation logic. It has interval selectors, interval counters and various configuration options for fine-tuning the aggregation logic upon certain needs.
Interval selectors define the criteria for sequential messages aggregation into intervals. Interval selectors are responsible for the “begin”, “end” and “duration” fields in the interval JSON.
Interval counters aggregate messages within an interval and store their aggregated value into interval JSON under a fixed user-defined field name. Interval counters sequentially calculate messages inside interval and are responsible for filling interval JSON with actual data.
In order to apply the configuration defined in the calculator to a specific device and activate its intervals calculation you need to assign the device to the calculator.
Calculators
Calculators carry all the logic needed for interval generation.
Calculators can be nested — one calculator can operate on the intervals already generated by another calculator.
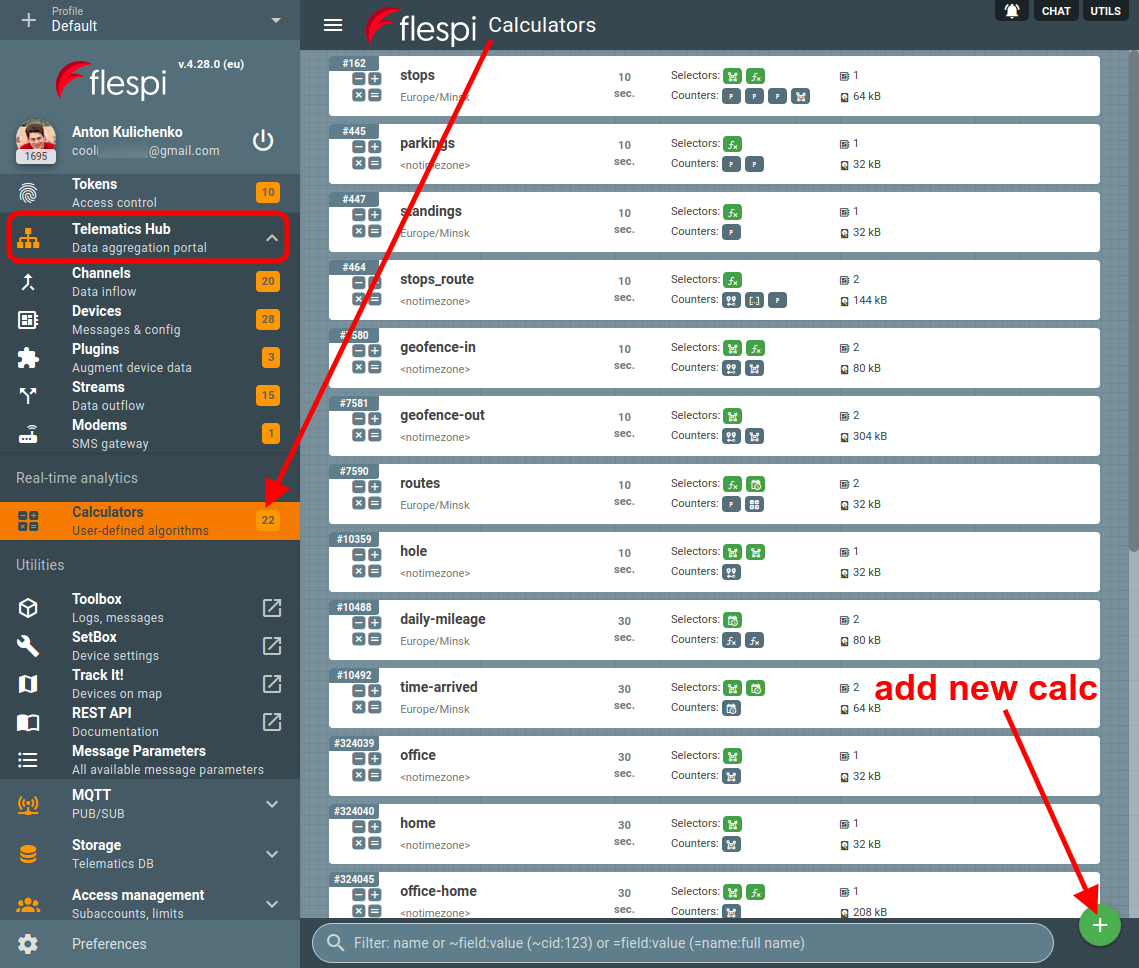
To create a new calc, open the flespi panel -> Telematics hub -> Calculators -> “+” button.
Calculator configuration consists of:
Interval selectors whose task is to split all source messages into intervals.
Interval counters that perform specific calculations within each interval.
"validate_message" parameter contains a boolean expression and allows to filter out messages from being supplied to calculator selectors and counters. You can use it to skip messages that do not contain a certain parameter for example.
"validate_interval" parameter contains a boolean expression that will check generated interval JSON representation and may filter it out if validation fails. In the expression you reference JSON fields of the calculated interval. To access counter values of previously calculated and stored interval use the previous("counter-name") function.
"timezone" parameter specifies the default timezone to be used for all date and time functions in all calculator’s expressions.
geofences that are assigned to that calculator and can be hit-tested in all calculator's expressions.
assets assigned to the calculator to access in calculator's expressions assets with which calculated device was linked at each particular time.
"update_delay" parameter specifies how many seconds a calculator should wait after the moment it receives the new message to start recalculation. The default value is 10 seconds. For near real-time processing, you may specify a 1-second delay while for better notifications accuracy and lower number of interval events, you may set a 60-second delay or even more. We recommend keeping the update_delay value from 10 to 30 seconds.
"intervals_ttl" parameter contains the duration of history storage for calculated intervals. Intervals usually consume much less storage than raw device messages (about 1% of it) and you may configure a calculator to store intervals for a few years while device messages can be stored for a few days or months only.
"intervals_rotate" parameter - if non-zero, defines the maximum storage size for calculated intervals per each assigned device. If newly detected intervals overflow the specified size, earlier intervals will be removed automatically from the storage. This parameter may be used to limit the maximum storage size for the calculator.
"update_period" parameter specifies a valid interval update period from the current moment and backwards. During any recalculation, all intervals with end time outside this period will be ignored even if recalculation was triggered by the calculator parameters change. If set to standard value like 30-60 days, this parameter is a good way to ignore any outdated messages and retain all generated intervals as is, until they are auto-deleted by intervals_ttl. Our recommendation is to keep a healthy relation of update_period < messages_ttl(device) < intervals_ttl.
"update_onchange" parameter controls the behavior of the analytics system when the calculator configuration is changed (interval selectors, interval counters, validate message, validate interval or timezone). With true value (default) the system will synchronize all device intervals according to a new calculator configuration within update_period. So if you change selectors, counters, or validation fields — you will almost immediately see the effect with intervals created, updated, deleted events. While false value will prevent any automatic synchronization to currently existent intervals and will only use the new configuration for new device messages processing. This is convenient to set in production level calculators with thousands of devices assigned to prevent flooding of your handlers with interval update events.
"messages_source" parameter allows specifying the data source for the interval calculation — it can be either raw messages from the device or interval messages from another calculator. This is usually used to calculate aggregated statistics over a date range, e.g. you may have a calculator for each individual trip and have one calculator on top that will calculate daily stats for all trips — how many trips were done, what the total duration and mileage are, etc. If a calculator is configured to take source messages not from a device but from another calculator, make sure that your expressions there are referencing parameter names same as counters defined in another calculator and not original parameter names from device messages.
Interval selectors
Intervals selectors are used by the analytics engine to split device messages into intervals based on user-defined criteria. Selectors are responsible for providing interval JSON with ‘begin’, ‘end’ and ‘duration’ fields.
Interval selector determines the state of each analyzed message sequentially, and assigns each message one of the following statuses:
ON — message belong to interval, interval is created or continues;
ON_NEW — message belong to interval, but interval should restart;
OFF — message does not belong to the interval, interval should stop;
UNKNOWN — unable to calculate;
So, to generate one interval it is enough to have at least one message marked ON or ON_NEW. If the interval consists of one message only it will have zero duration.
Each interval selector type defines its own logic to include or exclude messages from the intervals. But they all share the same set of common parameters that make the configuration of the selector more precise:
min_active — prevents activating intervals where the active state duration is less than the specified value (in seconds). The system tests active state for each message and only includes segments in intervals when the active state persists for at least the specified duration, ignoring shorter active segments.
Example: "min_active=300" would mean that only segments where the active state lasts for 300 seconds or more will be included in intervals.max_active — start new interval when specified interval duration is exceeded.
Example: "max_active=600" would mean that when the interval reaches the duration of 600 seconds it will be stopped and the new interval will be immediately started.max_inactive — merge intervals if the period of inactivity between them is less than the specified number of seconds. Also, this property can timeout an active interval for the assigned device. Set to zero in order to prevent interval deactivation on timeout and react only on the actually received device messages.
Example: If you want to detect trips and parkings but do not want to consider stops at traffic lights as parkings, you specify this property with the value greater than the maximum duration of stop at traffic lights. If you set "max_inactive=60", stops shorter than 60 seconds will count towards the current interval.
Important: The max_inactive parameter also controls interval timeout behavior: active intervals remain open for the specified duration after the selector condition becomes false, and will continue if new messages re-satisfy the condition during this grace period.min_duration — save intervals of the specified minimum combined duration; shorter intervals will be skipped.
Example: "min_duration=300" would mean that the minimum duration of the resulting interval after combining all parts accounting for the specified max_inactive value should be 300 seconds, otherwise such interval will be skipped.
Best practice: Use min_duration parameter to define minimum interval duration requirements rather than filtering with validate_interval="duration > X". These parameter inform the analytics engine about your expected interval durations, ensuring consistent behavior between real-time and historical calculations.max_messages_time_diff — maximum timestamps difference between two messages to include into the interval and apply merge_xxx options (see below).
Example: "max_messages_time_diff=60" would mean that messages closer than 60 seconds apart will be registered into the same interval; messages further than 60 seconds apart will be registered into different intervals.merge_message_after/merge_message_before — extend the interval by one message with OFF/UNKNOWN state in the respective direction.
merge_unknown — append message with the unknown state to the active interval. The unknown state can appear in an expression type selector when a message does not contain a parameter specified in the expression or in a geofence type selector when there are no coordinates in the message.
invert — invert the result of interval state evaluation (e.g. ON will become OFF).
Example: if you have a geofence selector and want to detect when a device leaves this geofence (in contrast to detecting when a device gets into the geofence), you want to enable the "invert" property.
In the selector's expressions you are able to access the parameter value of the previous message with the previous(“parameter-name”) function.
You can define up to three selectors in a calculator. The conditions will be combined using AND logic.
Interval selector of type “expression”
Generates intervals based on the result of expression that evaluates device message parameters, assigned geofences, device metadata.
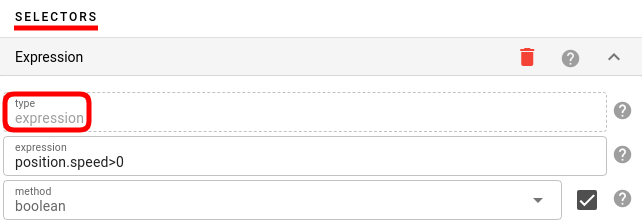
“method” parameter specify how to interpret the expression evaluation result:
“boolean” (default) — meaning the expression will be evaluated as a boolean, setting ON (create new or continue active interval) or OFF (stop active interval, if any) for the interval state according to the expression evaluation result. This method will create intervals occasionally, when certain condition set by expression is met.
“change” — meaning the new interval will start (ON_NEW) every time the expression evaluation result changes and continue existing interval (ON) when expression evaluation is the same. This method will create interval sequentially one by one. Each device message will always belong to some interval in this mode. And each next device message will either belong to the same interval or start a new one depending on the condition in the expression. When expression evaluation result changes with each next device message (e.g. "timestamp" in expression) you will end up with individual intervals per each message.
If you want to access per-device data (e.g. configured speed limit) in the expression you may use device metadata for this.
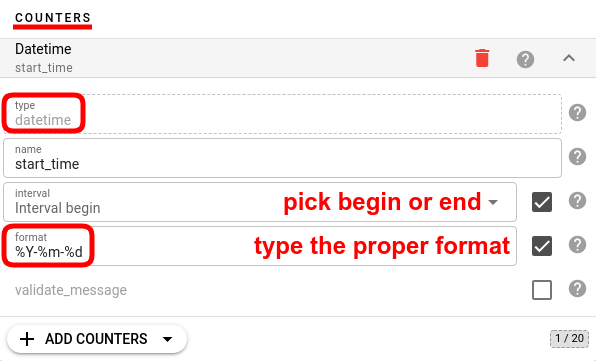
Interval selector of type “datetime”
Defines a new interval when the current hour/day/week/month/year changes according to a configured timezone.
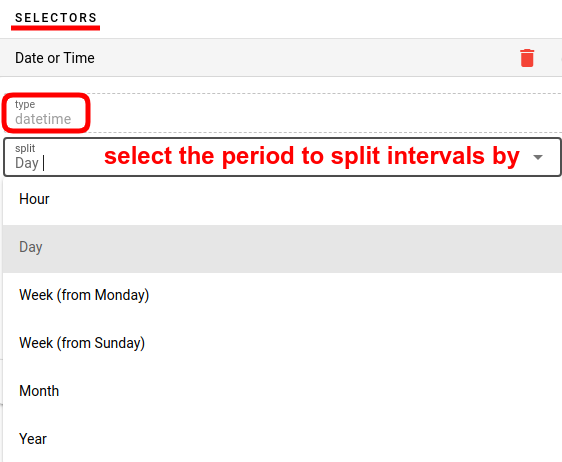
Use to aggregate device messages on an hourly, daily, monthly, yearly basis.
Interval selector of type “geofence”
Generates intervals based on geofence presence.
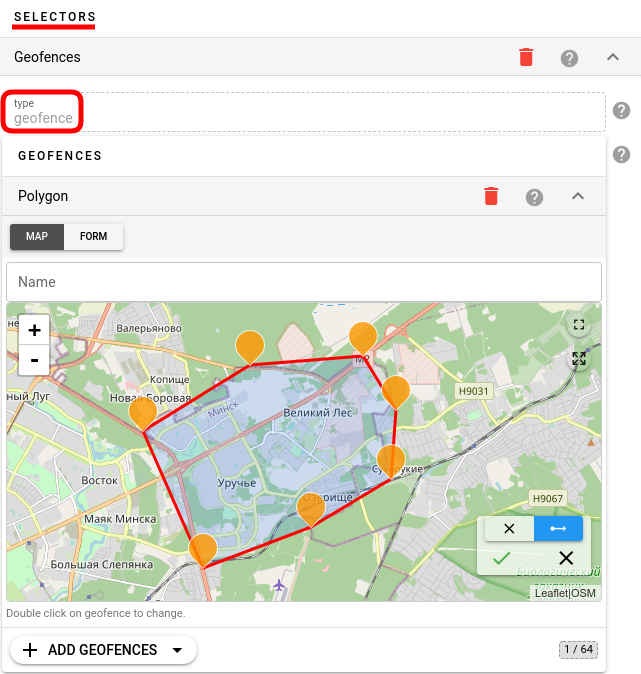
If the “invert” parameter is false (by default), the selector will generate intervals when the device is inside geofence. If the “invert” parameter is true, the selector will generate intervals when the device is outside of controlled geofences.
The source of geofences for the selector is defined by the “geofences” parameter. If the “geofences” parameter is not set in the selector's configuration all geofences assigned to the calculator and device will be used for the hit test automatically.
If you want to configure geofences geometry directly in the selector configuration inside the “geofences” parameter you will not be able to use geofences linked to this calculator or device for detection.
Together with this selector, you may use the geofence counter to store the name of the triggered geofence into interval JSON. However this will only work when the “invert” parameter is false.
Interval selector of type “inactive”
Generates intervals when gaps between messages or their reception latency is above the specified threshold.
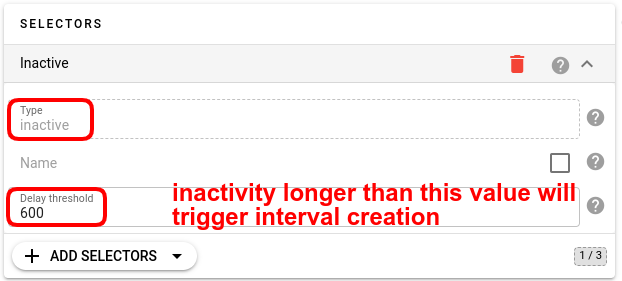
This selector also switches the assigned device to the "active" state if there are no messages from the device within the specified latency threshold. Usually is used to detect inactive devices in real time or connectivity problems in historical messages.
Interval selector of type “calc”
Used in cases when actual definition of intervals is performed by another calculator.

If the “invert” parameter has a false value (by default) it will copy intervals begin and end time from another calculator.
If the “invert” parameter has a true value it will create intervals based on gaps between other calculator intervals. In the latter case it is a convenient variant to define opposite types of interval events. For example you may define a trip calculator that will detect trips and create parkings calculators with selector type=calc, calc_id={trips_calc_id} and invert=true.
If intervals in the referenced calculator are changed this calculator will automatically recalculate its own intervals as well. When used in reverse=true mode it is recommended to match min_active parameter to max_inactive for both calculators to have maximum consistency in the behavior of both calculators and prevent false interval events.
Interval counters
Counters are responsible for calculating all device messages within a single interval and extracting valuable information.
Each counter has the "name" parameter specifying the interval JSON field name under which the value calculated by the counter will be stored. You can use any name for the counter except “id”, “begin”, “end”, “duration” and “timestamp” which are automatically added to the interval.
If counter value could not be calculated due to some reason null value will be stored in interval JSON instead.
If you want to access per-device variable data in counter’s expressions you may use device metadata for this. This is an efficient method to configure per-device speed limit, controlling geofence, some fuel calculation method and so on.
Counters calculate device messages in sequential order. In counter’s expression you are able to access the parameter value of the previous message with the previous(“parameter-name”) function.
Interval counter of type “expression”
Aggregates the result of expression evaluation over each device message within interval into a single value.
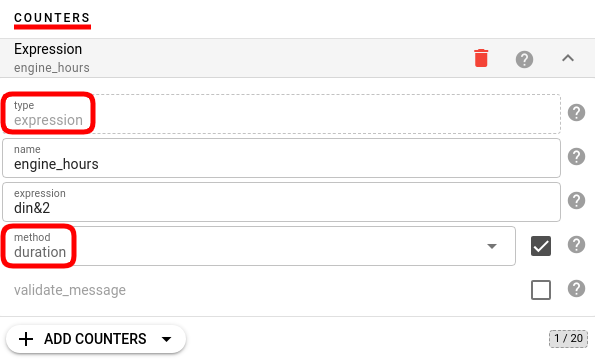
“method” parameter defines how to aggregate calculated value:
first — take the first evaluated value;
last — take the last evaluated value;
average — take an average value;
minimum — take a minimum value;
maximum — take a maximum value;
summary — summate all values;
difference — summate all differences between neighbor messages;
duration — evaluate the expression as boolean and summate duration between neighbor messages that both evaluated the expression to true;
Interval counter of type “message”
Add to the interval one or many device messages either as is or just a few fields from them. This counter supports aggregation of multiple messages into a single with summated fields or even it can aggregate and summate multiple messages by specified field or expression.
“validate_message” parameter is often used for this type of counter to filter which messages to include into the counter value.
“fields” parameter defines which fields to copy. If it is not specified then the whole message will be copied into the counter value.
“method” parameter defines which message to copy into an interval - first, last, each, aggregate or aggregate_by_field. When each method is specified, the result of the counter will be an array of messages.
“extremum” parameter allows you to find and include into the interval JSON the message(s) with a specific minimum or maximum value. For example, detect the time and position of the highest message latency or message with the highest speed. Not compatible with any of aggregation methods.
aggregate and aggregate_by_field methods allow to summate calculated device message parameters into single value. Aggregation will be useful for example when you need to enumerate all BLE beacons or driver ID encountered during the trip and aggregate device message calculations per each unique ID encountered. aggregate_by_field method automatically expands groups if aggregation field value is JSON array and suitable to generate separate aggregation group within standard flespi parameters such as "ble.beacons" or "can.dtc" for each distinct BLE beacon's "id" or DTC code value encountered. Keep in mind that aggregate_by_field cannot directly access properties within array elements. While it can group by beacon ID, any calculations must reference device-level parameters or pre-flattened beacon data.To handle BLE beacons as separate entries and calculate them distinctly we recommend to use ble-beacons channel and register each beacon as a separate device with own set of calculators.
Interval counter of type “interval”
Special type of counter that is calculated only after all previously defined counters already calculated their values and added their fields to the interval JSON.
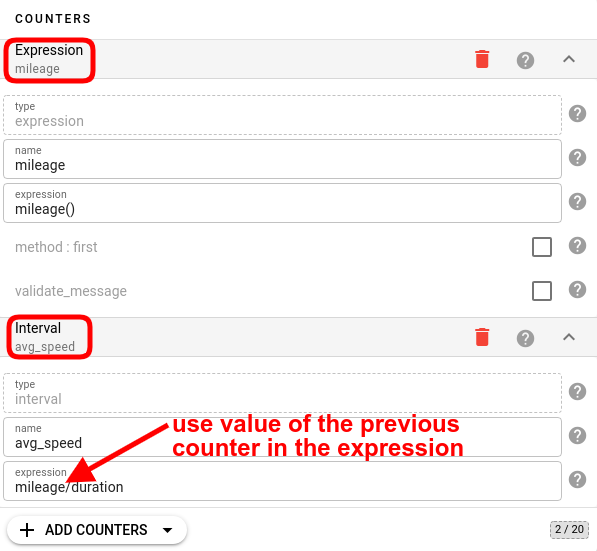
This counter evaluates expression over the interval JSON (references counter names as expression parameters) and is used to perform some post-calculation mathematical operations. For example to detect the average speed during the trip (e.g. to count total mileage/interval duration).
The expression is stateful - with the previous("xxx") function you may access values from the previous interval and even any custom parameter attached to the previous interval by the user (e.g. not calculated by the counter).
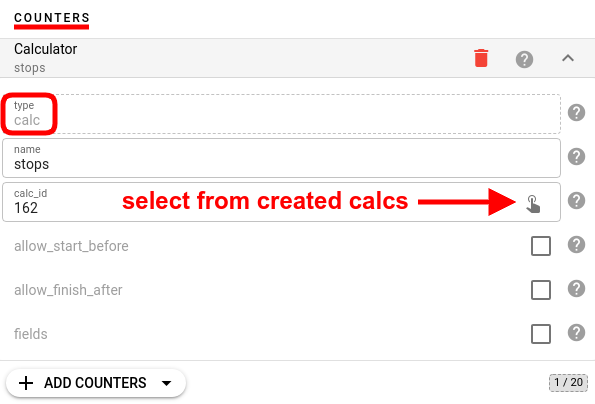
Interval counter of type “calc”
This is a powerful counter that adds to the interval JSON intervals generated by another calculator from the same device.
By default, only the referenced intervals within the time bounds of our interval are loaded into the counter, but it is possible to configure overlap from each side using allow_start_before and allow_finish_after flags. Additionally, you can specify exact time range for intervals lookup with lookup_time_before and lookup_time_after parameters.
“fields” parameter defines fields to copy from each referenced interval.
"method" parameter defines which interval to use — either first, last, each, aggregate or aggregate_by_field.
For the first or last method the counter value will be the referenced interval JSON.
When each method is specified, the result of the counter will be an array of referenced calculator intervals.
aggregate and aggregate_by_field methods allow to summate referenced interval fields. Aggregation will be useful for example when you need to calculate a time spent in different geofence within a day with detailed information about how much time was spent in each geofence.
The ability to look up intervals beyond current interval's time bounds is particularly useful for Hours of Service (HoS) calculations where you need to analyze cumulative metrics. For example, you can add to the current trip interval the combined driving time from all trips that happened within the last 7 days.
Interval counter of type “accumulator”
Special type of counter that accumulates value from another counter among multiple intervals.
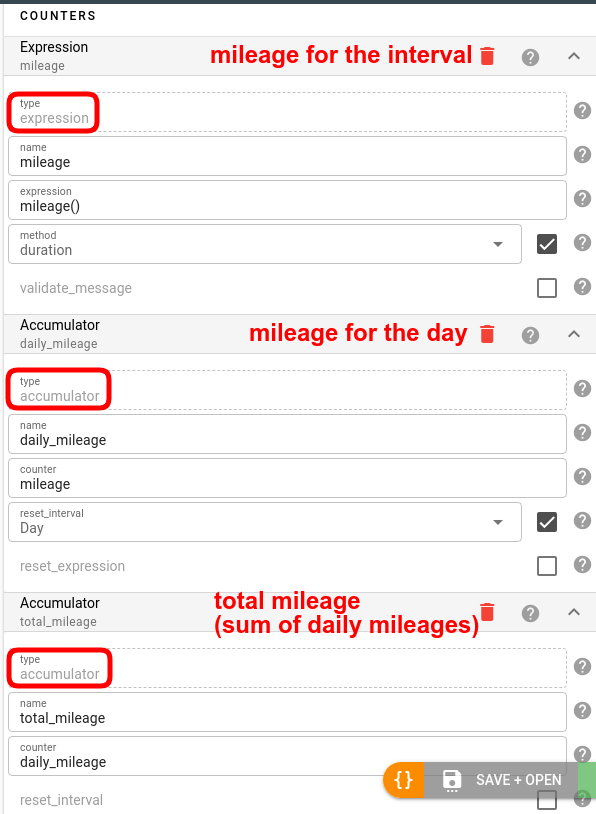
For example, you can have a mileage counter that will record the distance traveled for the given interval and a mileage_total counter of type=accumulator that will contain the total distance traveled within all previously calculated intervals including this one.
Optionally it is possible to specify a special expression that will reset the accumulated value and/or set the time for its resetting — e.g. daily, monthly, yearly, and so on.
Interval counter of type “active”
Dynamic counter with a true/false value depending if the currently calculating interval is considered active (not yet finished) or not.
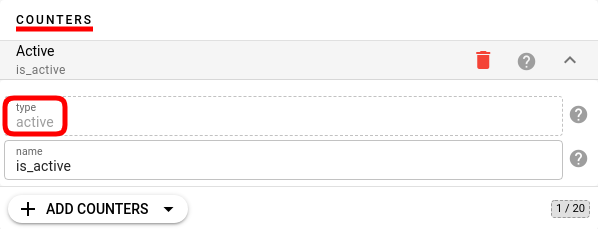
The counter always sets the "false" value for all intervals except for the last one. Will return "true" for the last interval if it is not yet finished according to the device messages data we have. Once the interval becomes inactive based on the selector criteria, the counter will switch to "false" for its field.
“max_inactive” parameter in interval selector configuration defines how long we consider the interval active since its last message if there is no actual data from the device.
Interval counter of type “specified”
Used to save into the interval field specified value under some name.
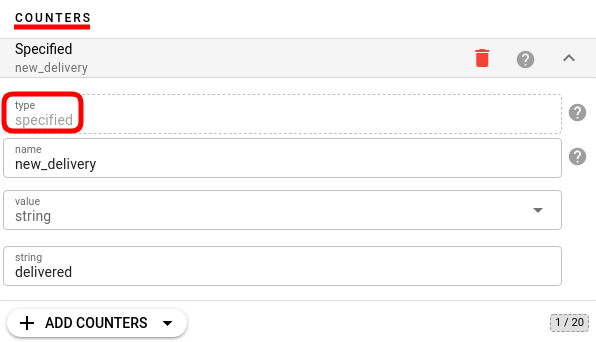
For example you can define a counter with name=”type” and value=”trips” and each interval generated by this calculator will have type=”trips” field. This is a convenient method to add to the interval information that is used for filtering or routing interval events in various MQTT event handlers, such as webhook.
Interval counter of type “parameter”
Used to copy parameter value from the device message into the interval JSON such as device ID or ident.
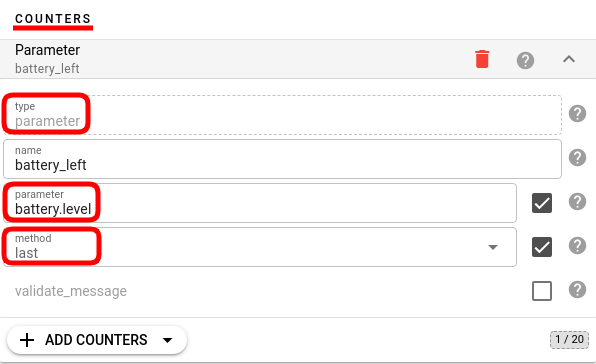
Message parameter which value to add to the interval is identified by name. If you want to apply an expression instead of specifying a parameter name please use counter of type=expression for this.
"method" parameter defines the device message from which to copy the parameter. It can be either first, last, distinct or each.
When a distinct method is specified, the result of the counter will be an array of distinct parameter values encountered in device messages.
When each method is specified, the result of the counter will be an array of parameter values gathered from device messages within interval.
Interval counter of type “dataset”
Used to add to the interval an array of objects, whose field names and values are defined by the schema in counter configuration.
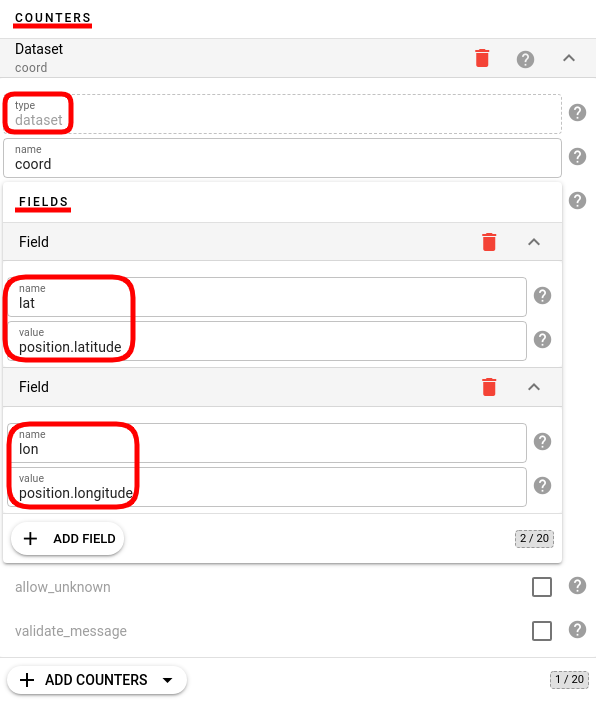
The values for the fields are evaluated as an expression over device messages.
Dataset counter is used when you need to access each message field and add them to an interval as an array.
Please note that intervals for the dataset counter can grow in size quite fast so we recommend using the shortest possible field names. If you just need latitude and longitude pairs for each message in the interval, please check the route counter.
Interval counter of type “route”
Adds to the interval a compressed string in Google-encoded polyline algorithm format with "position.latitude" and "position.longitude" parameters for all messages in the interval.
This is a compressed string-based coordinates format with plenty of libraries to decode it into actual numerical latitude/longitude pairs.
Interval counter of type “datetime”
Adds to the interval user-formatted interval begin or end time according to the specified timezone.
Interval counter of type “geofence”
Adds to the interval a name of geofence that triggered interval in the geofence selector.
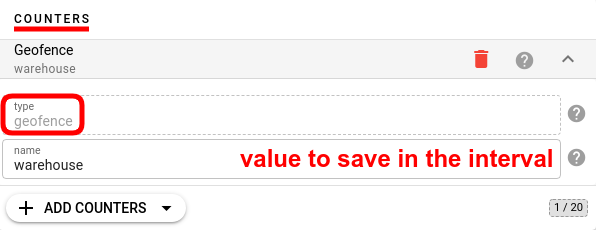
This counter is applicable only with a geofence selector and only when its invert parameter is false - e.g. when the interval is created when the device is inside geofence.
Consider using alternative counter type=expression and geofence() function for more advanced control of adding geofence names to the interval.
Interval counter of type “variable”
This is a virtual counter that does not add any value into interval JSON but is used to maintain and access sequential calculation state in other counters.
It calculates some value according to the provided expression and makes it available for using in subsequent expressions inside this and other counters. Variable value inside expressions is accessed with a variable("counter-name") call. State is updated with each next message pass.
Last calculated value can be used to validate the final interval JSON as well.
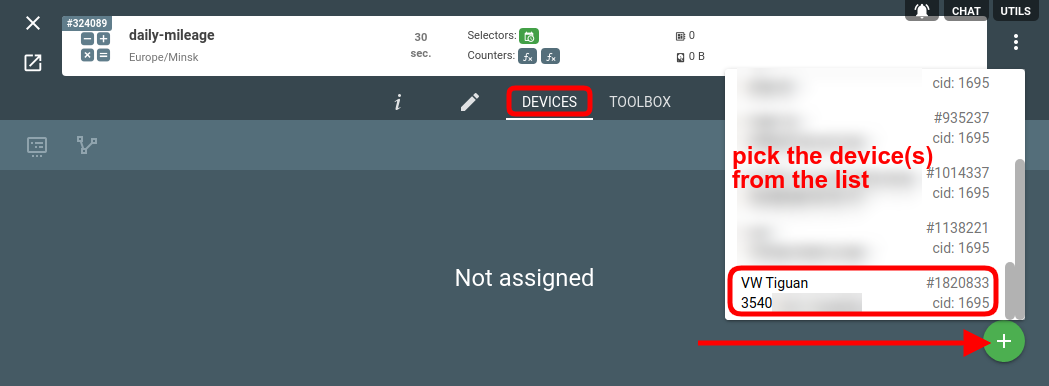
Assigned devices: source of data for calcs
Once the calculator is created, it needs a source of messages to apply its algorithms to. To provide such a source, you should assign a device (or several devices) to the calculator. Open the Devices tab on the calculator card, click the green “+” button, and select the proper devices from the list:
After you assign a device, the calculator will automatically try to generate intervals based on the available messages. Calculation and synchronization take place in the background and may take up to one minute to complete. The green check means that everything went smoothly:
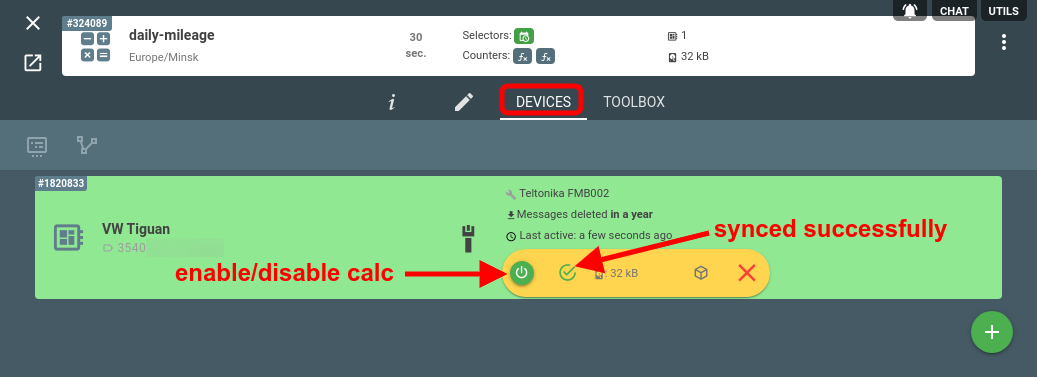
If it won’t sync (you see the orange ![]() icon), try disabling and enabling the calc.
icon), try disabling and enabling the calc.
Note: as new messages for the assigned device come, the intervals will recalculate automatically — no need for any actions from your side.
Anytime it is possible to enable and disable the device assigned to the calculator to activate or deactivate the automatic calculation engine. When disabled it will not react to any incoming messages from the device and will not modify intervals. But once enabled it will recalculate all intervals automatically and return back into the synced state.
For the assigned device, it is also possible to specify time boundaries for calculation. If time_begin or time_end is specified, only messages within the configured boundaries will trigger interval calculations. All previously detected intervals outside the specified boundaries will remain as is. These parameters are convenient to use when you want to change calculator configuration but want to preserve all currently calculated intervals for the device. In that case you set time_begin to the current time and may safely change the calculator configuration, assigned geofences or change device’s metadata.
Intervals
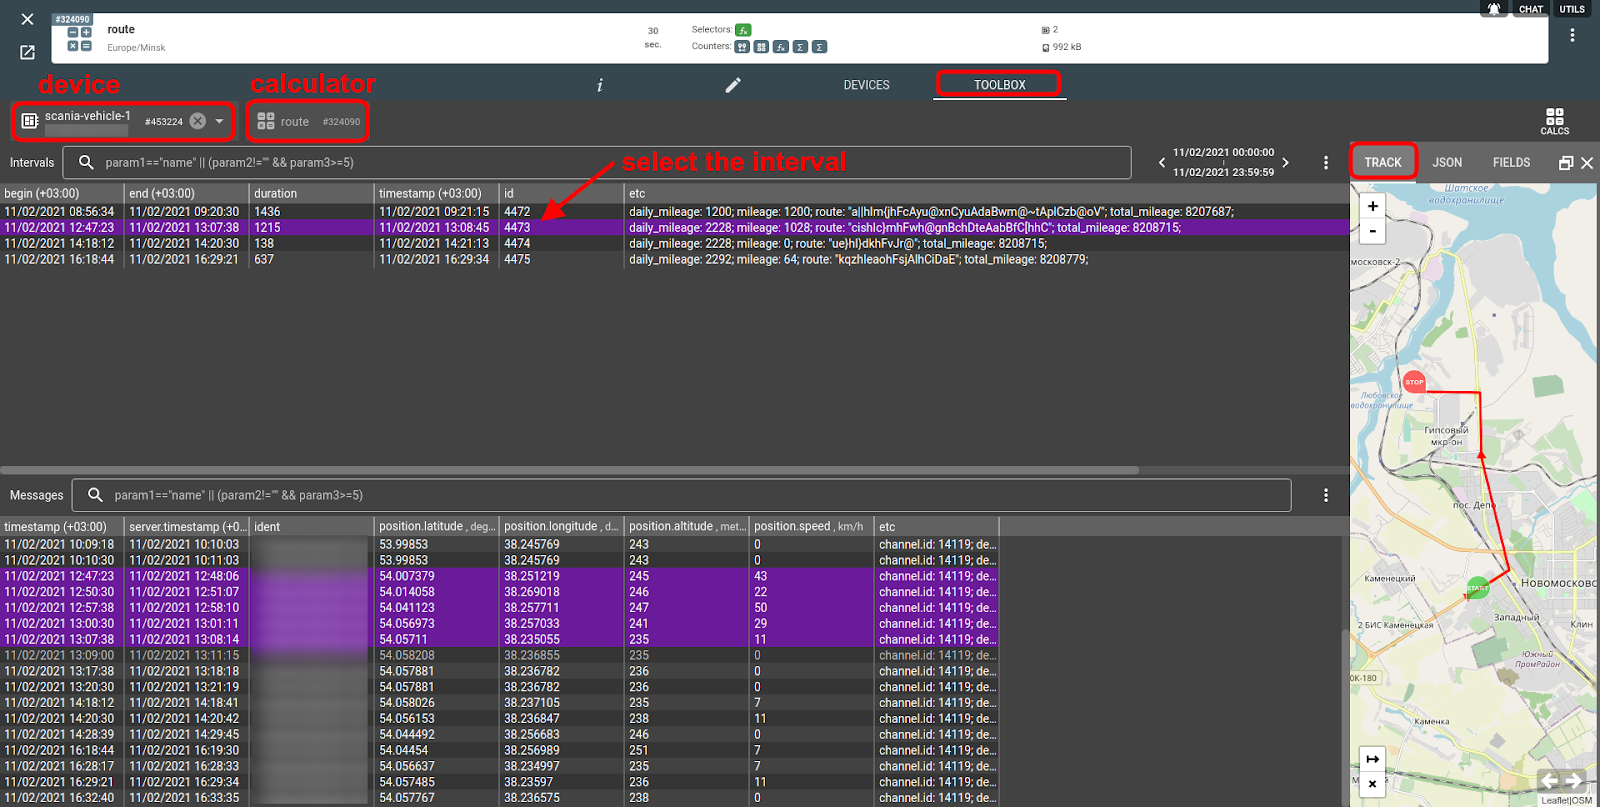
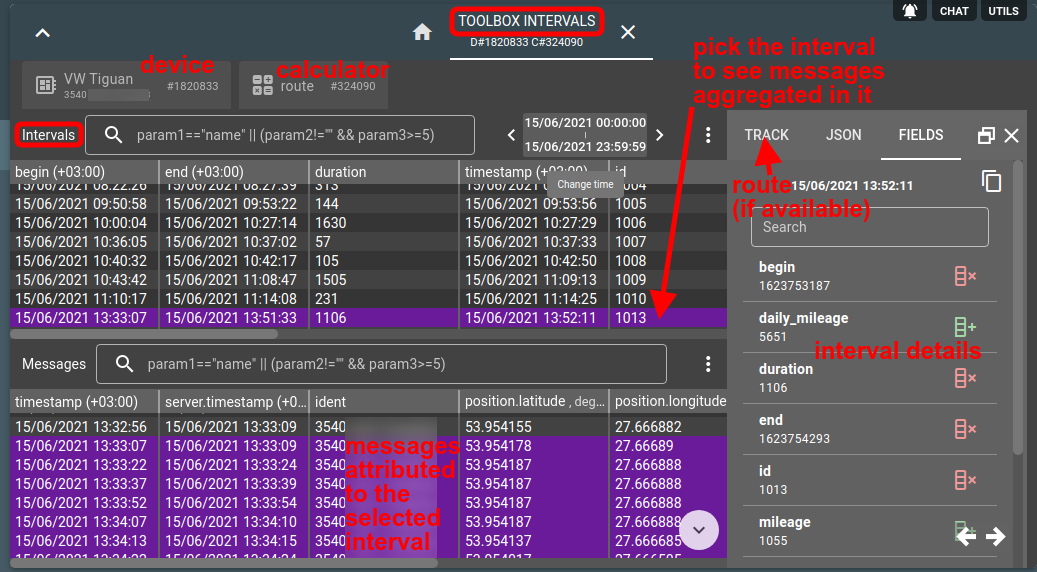
You can see the generated intervals by clicking on the Toolbox icon on the assigned device card:
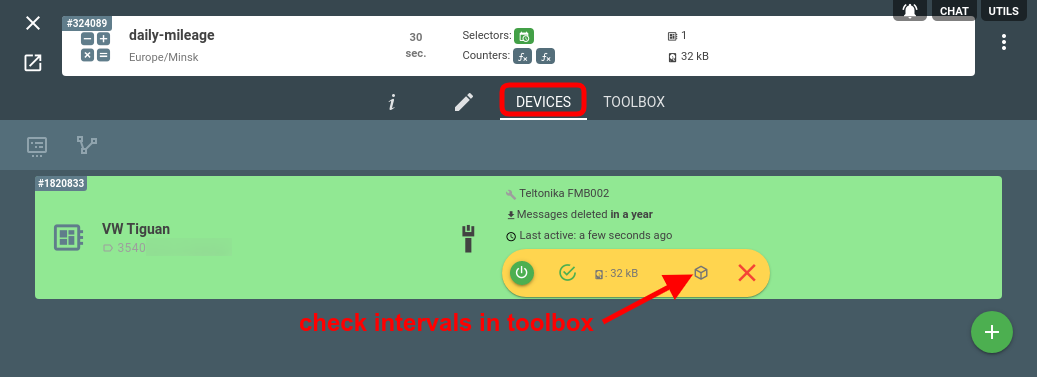
In Toolbox, you can see all generated intervals, messages, and interval details including all parameters, its JSON representation, and a corresponding track (if the interval contains a “route” counter):
Intervals recalculation and synchronization
Device assigned to the calculator automatically detects when:
Device received a new message either directly or via REST API;
Calculator configuration has changed;
Geofence assigned or unassigned from device or calculator;
Device metadata has changed;
Active interval timeouted;
User changed parameters of assigned device;
If assigned device is synced and enabled upon any of these events the analytics engine performs automatic recalculation of device messages according to actual calculator configuration and synchronizes all changes to stored intervals, if any.
During the recalculation of device messages once an interval is calculated, the analytics engine will try to find intersections with already stored intervals based on interval begin and end times. If found, the engine will use the ID of the first existing interval, modify it, and generate the interval 'updated' event. If no existing intervals within begin and end times of newly calculated interval are found, the newly calculated interval will be assigned its own ID and flespi will generate the interval 'created' event. All existing intervals that should not exist anymore will receive the interval 'deleted' event and will be deleted from the intervals storage.
Interval ID is unique within a single device and incrementing on each new interval. But between different devices there can be created multiple intervals with the same ID. Thus to uniquely link an interval from an analytics engine in your system you should use a pair of device ID and interval ID as a key.
Analytics API: extracting intervals from your solution
Ultimately, you want the interval data from flespi to end up in your app. The options to deliver the data where it’s expected are as follows:
REST API - to pull intervals from flespi via REST;
MQTT API - to receive push notifications about any event happened to the assigned device or its intervals;
Webhooks — to deliver analytics events to your application using HTTP request from flespi to your lambda.
Push interval events to your solution using flespi streams.
We suggest using MQTT or webhooks for catching notifications events and REST API for reports or interval data access.
MQTT topics
MQTT topics for assigned device that reflect its current state are:
flespi/state/gw/calcs/{calc_id}/devices/{device_id}/synced — contains true or false for the current synchronization state of a given device calculator. You may rely on the calculated intervals only when this property becomes true.
flespi/state/gw/calcs/{calc_id}/devices/{device_id}/last — contains the last detected interval JSON. This is a convenient topic if you want to understand the current status of a device, e.g. its current geofence position, current trip, or parking. Topic is published on any change to the last interval JSON.
flespi/state/gw/calcs/{calc_id}/devices/{device_id}/active — in case the last detected interval is currently active will have the same value as last, otherwise N/A (null).
Two more topics without retained messages are important if you want to build a notification system on top of flespi analytics. The payload for these topics is the last known interval JSON:
- flespi/interval/gw/calcs/+/devices/+/activated — the event is triggered when the device assigned to the calculator becomes active according to calculator configuration or the active interval ID has changed. For example, if the selector is ON when the device is inside a defined geofence, this topic will be published when the device enters the geofence for the first time.
- flespi/interval/gw/calcs/+/devices/+/deactivated — the event is triggered when the device assigned to the calculator becomes inactive according to calculator configuration or previously active interval ID changed. For example, if the selector is ON when the device is inside a defined geofence, this topic will be published when the device exits the geofence after being inside.
You can track any change that happens to intervals by subscribing to the following MQTT topics where the interval JSON is posted as a payload:
flespi/interval/gw/calcs/{calc_id}/devices/{device_id}/created — new interval created.
flespi/interval/gw/calcs/{calc_id}/devices/{device_id}/updated — interval field values have changed.
flespi/interval/gw/calcs/{calc_id}/devices/{device_id}/deleted — interval is no more valid and deleted.
REST API
To access calculated intervals you can issue GET /gw/calcs/{calc_id}/devices/{device_id}/intervals/all API call. Each returned interval will contain automatically calculated fields plus any custom fields that you attached. You can query intervals at specific times by setting ‘begin’ and ‘end’ parameters in the data section of this call.
To access specific interval or when you need to attach custom data to it, use GET|PUT /gw/calcs/{calc_id}/devices/{device_id}/intervals/{interval_id} API call. If custom data is attached to the interval, the updated event will be generated and if this is the last interval, then the last retained MQTT message will also be re-generated reflecting fields that you changed. Custom attached fields are static and isolated from the calculation process — they won't trigger interval recalculation and cannot be referenced in interval calculations or counters.
It is also possible to manually calculate generalized intervals on top of precalculated ones. This can be done with GET /gw/calcs/{calc_id}/devices/{device_id}/intervals/calculate API call. In this API call selectors and counters will operate not with device messages but with precalculated interval messages. This is a convenient and quick method to aggregate calculated intervals on the flespi side - e.g. calculate how many trips were per year, what was their average speed, total duration, mileage and so on.
Troubleshooting
You can find all log records related to the calculator in the Logs tab on the calculator screen:
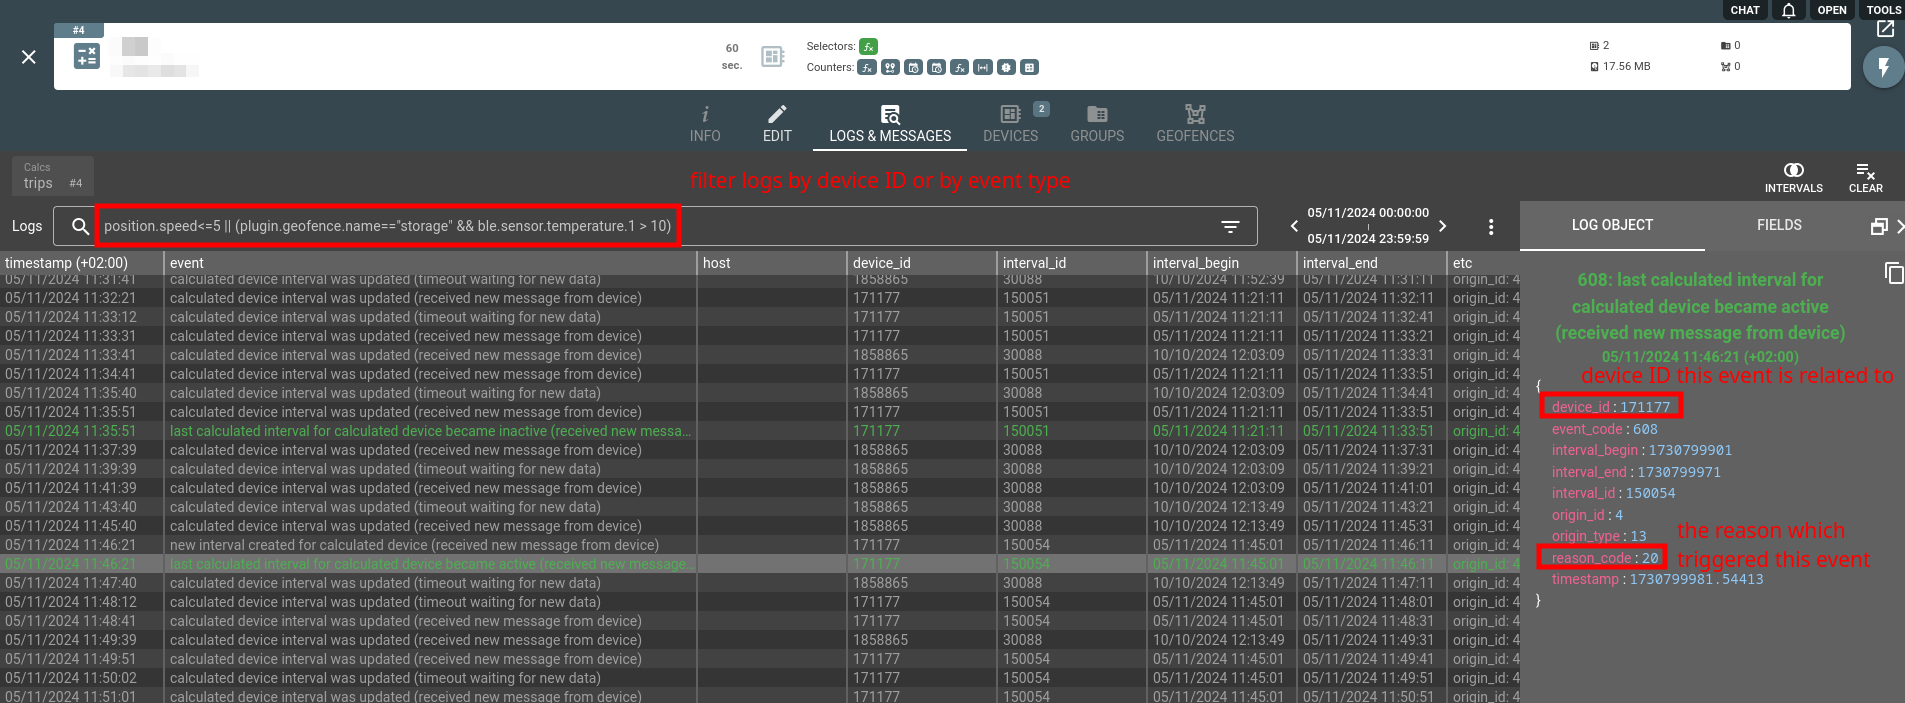
You may filter calculator logs by showing events only related to the particular device by entering into filter: “$device_id == xxx || $device_id == 0” and pressing Enter. This will show only general logs from the calculator and any device specific intervals processing events.
If intervals are detected when manually recalculating historical data but not during real-time operation, check if you're using validate_interval="duration > X" to filter short intervals. This approach doesn't provide the analytics engine with information about your expected interval durations, resulting in insufficient message calculation windows for real-time detection. Use min_active and/or min_duration interval selector parameters to ensure minimum interval duration instead.
Interval event reason codes
By checking reason_code field from interval event you can understand what was the reason of interval calculation. We define next reasons:
Code | Description |
| 2 | Timeout waiting for new data |
5 | Referenced information has changed, e.g. intervals from referenced calculator |
10 | Interval modified via REST API |
20 | Received new message from device |
| 48 | Calculator geofences change |
| 49 | Device metadata change |
50 | Calculator configuration change |
90 | Automatic recalculation due to assigned device properties change |
95 | Recalculation due to internal reason (unspecified) |
100 | Initial automatic calculation |
200 | Manual (forced) synchronization request via REST API |
250 | Calculated device is disabled |
Known limitations
If the assigned device remains in unsynced state for more than a minute you have to check the calculator configuration. If there are some selectors or counters which state is not possible to detect, the system will wait until all selectors and counters are operable. Most common example of devices that are unable to synchronize is when the selector or counter references another calculator for which this device is not yet assigned or not synchronized.
Maximum size of data inside each counter can not exceed 8MB. If it is larger during interval generation the counter value will reset to null and the corresponding log message will be added to calculator logs (event_code = 614).
Maximum total JSON size for the interval message can not exceed 16MB. If it will be larger during generation - calculated device will be disabled with the reason indicated in calculator logs (event_code = 615).
Be aware that analytics may activate additional throttling for your interval detection events if the logic in selectors or counters is too heavy, intervals are too long or update_delay value is too low. This throttling system is activated automatically and the maximum additional delay it can add is 5 minutes.
The calculator can store up to 10 years of historical information per each assigned device. This is an efficient option to save your flespi storage costs because the size of information aggregated by calculator is just a fraction of the size used by device messages. However if you unassign the device from the calculator or delete the calculator you will lose that information.
And there is no possibility to move the calculator between subaccounts but you can use grants to provide access to the calculator from another account. So if you want to store in calculator aggregated device data for 10 years ahead the careful account structure design should be done in advance.