Just recently, we hosted our first webinar on the same topic as the title of this article. If you missed this highly informative and occasionally hilarious overview of the flespi functionality by our developer Jan Bartnitsky, watch it now:
If you are the reading type or want to learn what exact topics were covered, we’ve put together the highlights on the webinar accompanied by the links to specific chapters so that you can watch exactly what you are willing to.
Getting into flespi / Tokens (go to video)
You can log in into the flespi panel via email/password, social network account, or token.
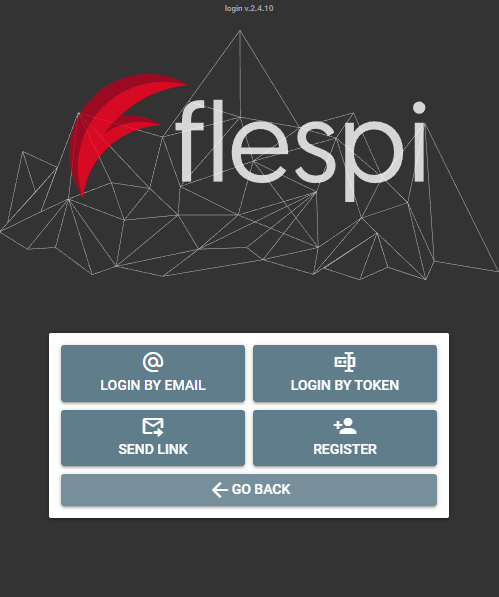
A nice lifehack is to bookmark your login link with the valid token to be able to instantly open your flespi account:

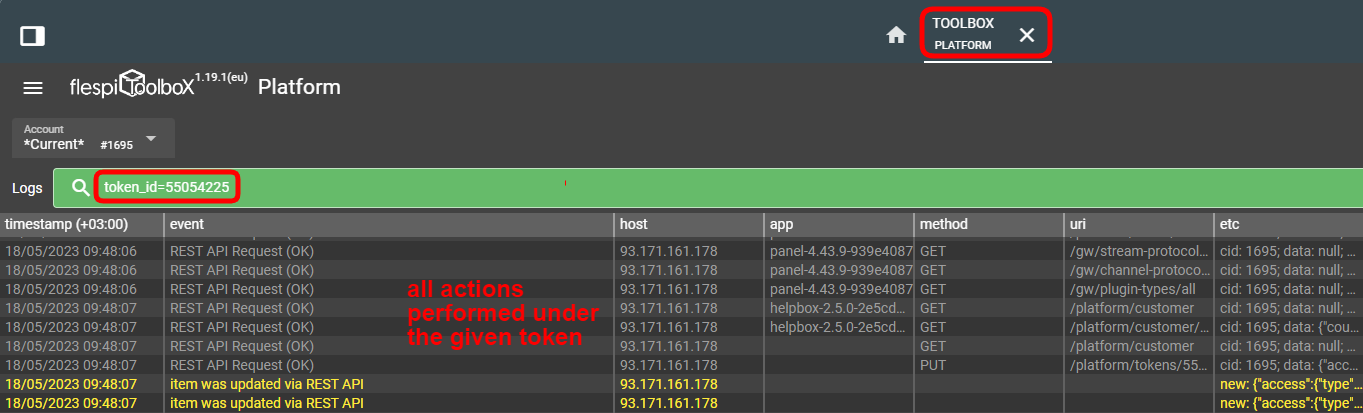
Tokens are also used to share access to all or part of the flespi instances with colleagues, contractors, HW manufacturers, etc.
You (as an account owner) can always trace the activity under specific token in the Platform logs (item in the left-side menu) by filtering them by specific token ID:
Grouping options (go to video)
Since flespi empowers users to operate thousands, tens of thousands, and even more instances, it also offers multiple options to structure such numbers on different levels.
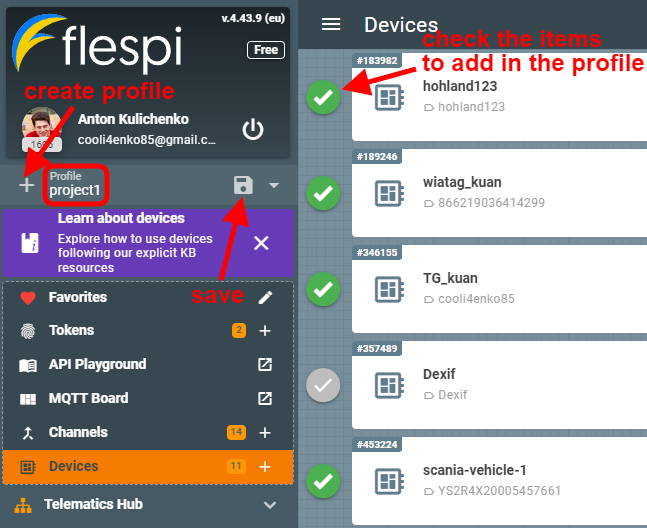
Profiles
This is a UI feature (no respective API call for it) to logically group items, for instance, related to a particular project.
Groups
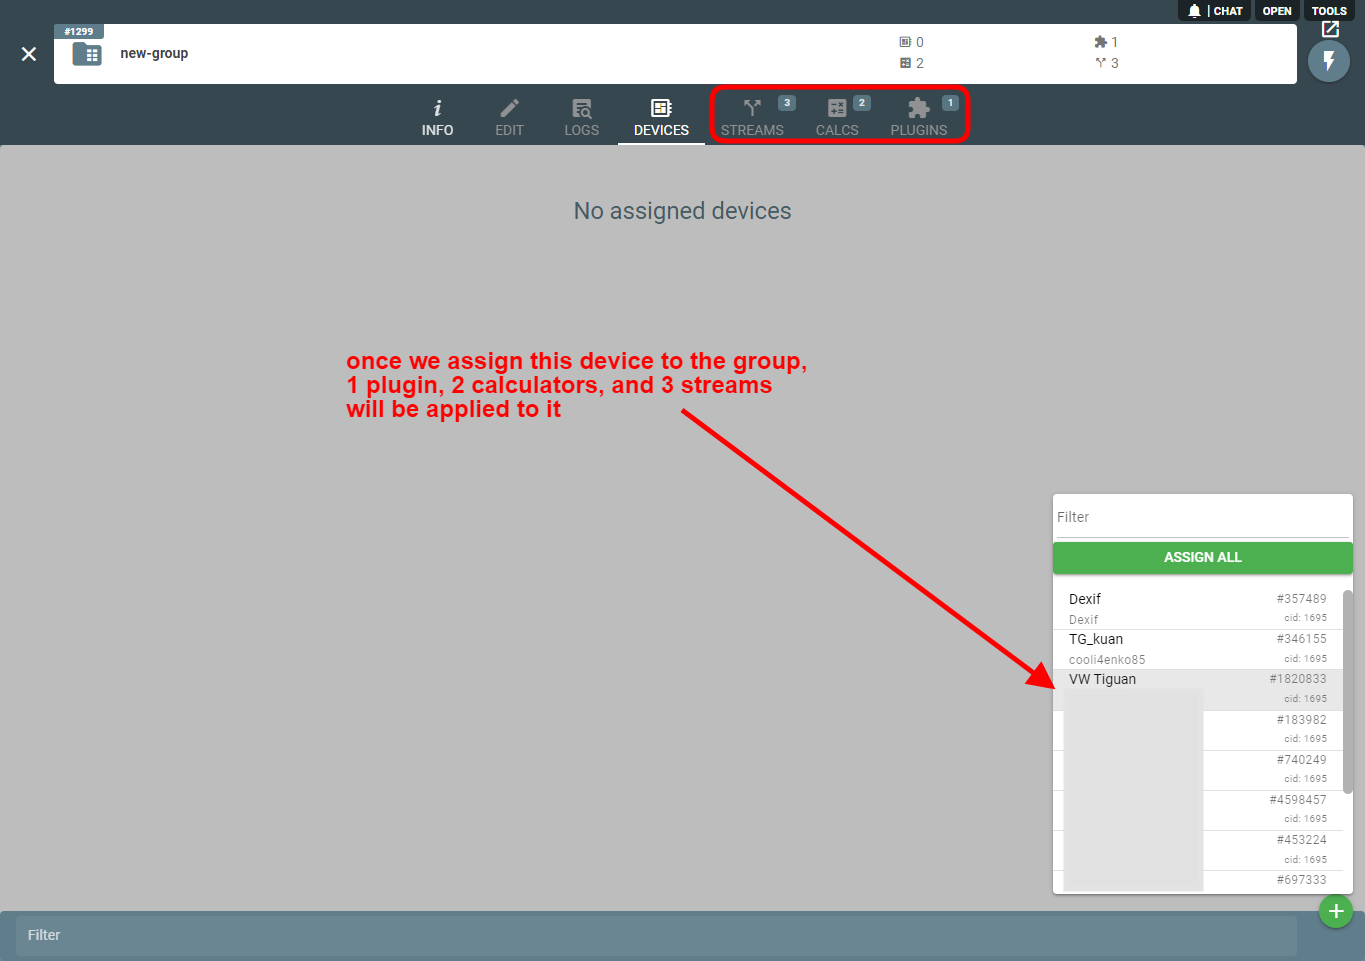
Groups are actually an automation tool — the plugins, streams, calculators assigned to a group will automatically apply to all devices in the group.
Favorites
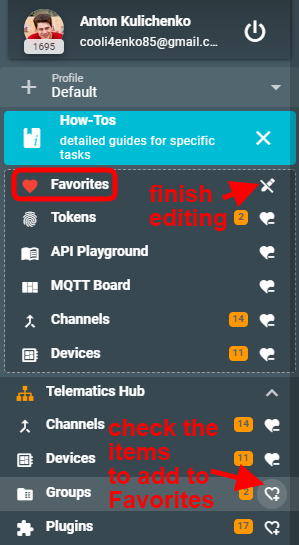
This is a panel appearance customization feature — you can add the menu items that you use most into the Favorites section for quick access.
Open item by ID
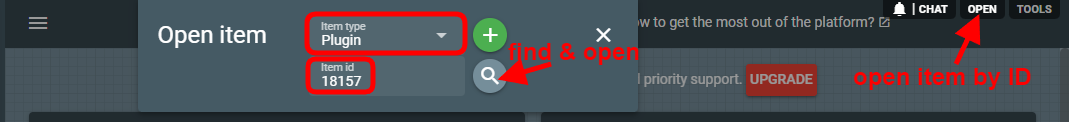
There’s a great (and slightly hidden) shortcut to quickly opening the desired flespi item when you know its ID. You just click the Open button in the top right corner of the screen, paste the ID, and the desired item details open right away:
Channels (go to video)
Channels are an essential item in your account — there’s no other way to get the telemetry data into the flespi platform. Here are some not-so-obvious things to keep in mind:
Messages TTL — since channels are not designed for storage, the default value is 1 day and can be extended to 30 days maximum or reduced to 0, which would mean that messages will be deleted once consumed.
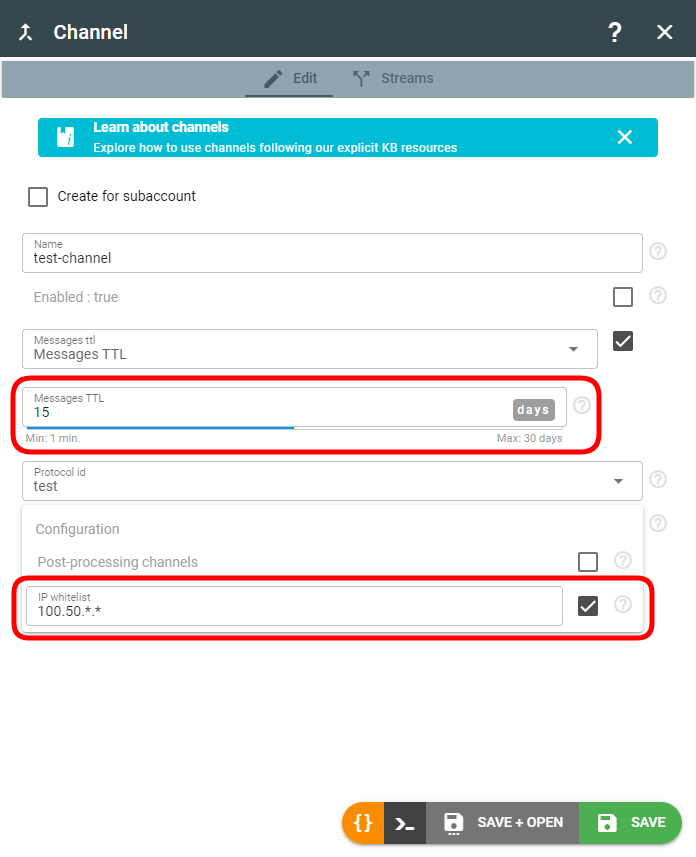
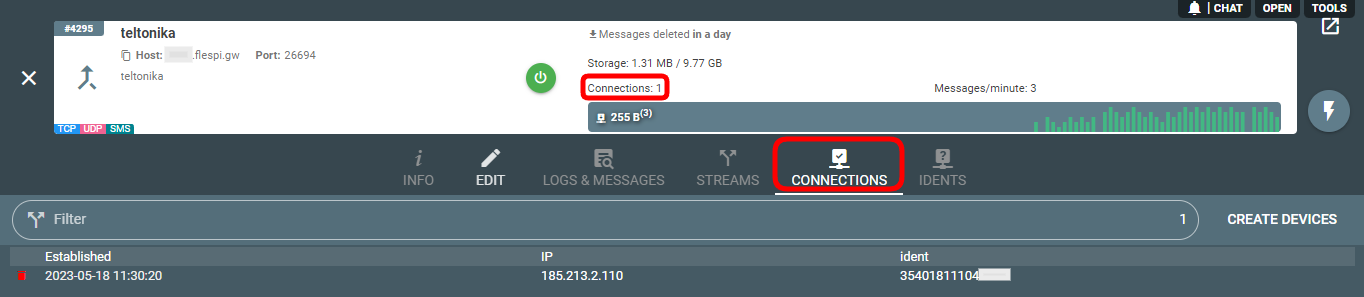
IP whitelisting — you can tell flespi which IP addresses (or masks) are allowed to receive data from (see screenshot above).
Connections limit. Each device connected to the channel represents a connection:
 The number of allowed connections per channel is determined by your pricing plan:
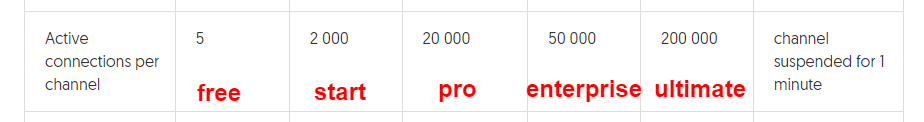
Troubleshooting — use Logs & Messages tab to see all messages (from all devices connected to the channel) and log records about all the activity in the channel:

Devices (go to video)
Flespi is a device-centric platform, so devices are always the center of attention since most of the functionality is applicable to them. Here are some interesting features you might not know:
Info tab
MQTT tab — device-specific MQTT topics to get state, events, logs, and more:

Parameters tab — see all parameters supported by the protocol that the given device works over:

Docs tab represents a part of the interactive API for devices where you can immediately try to execute a certain REST API call for the specific device:

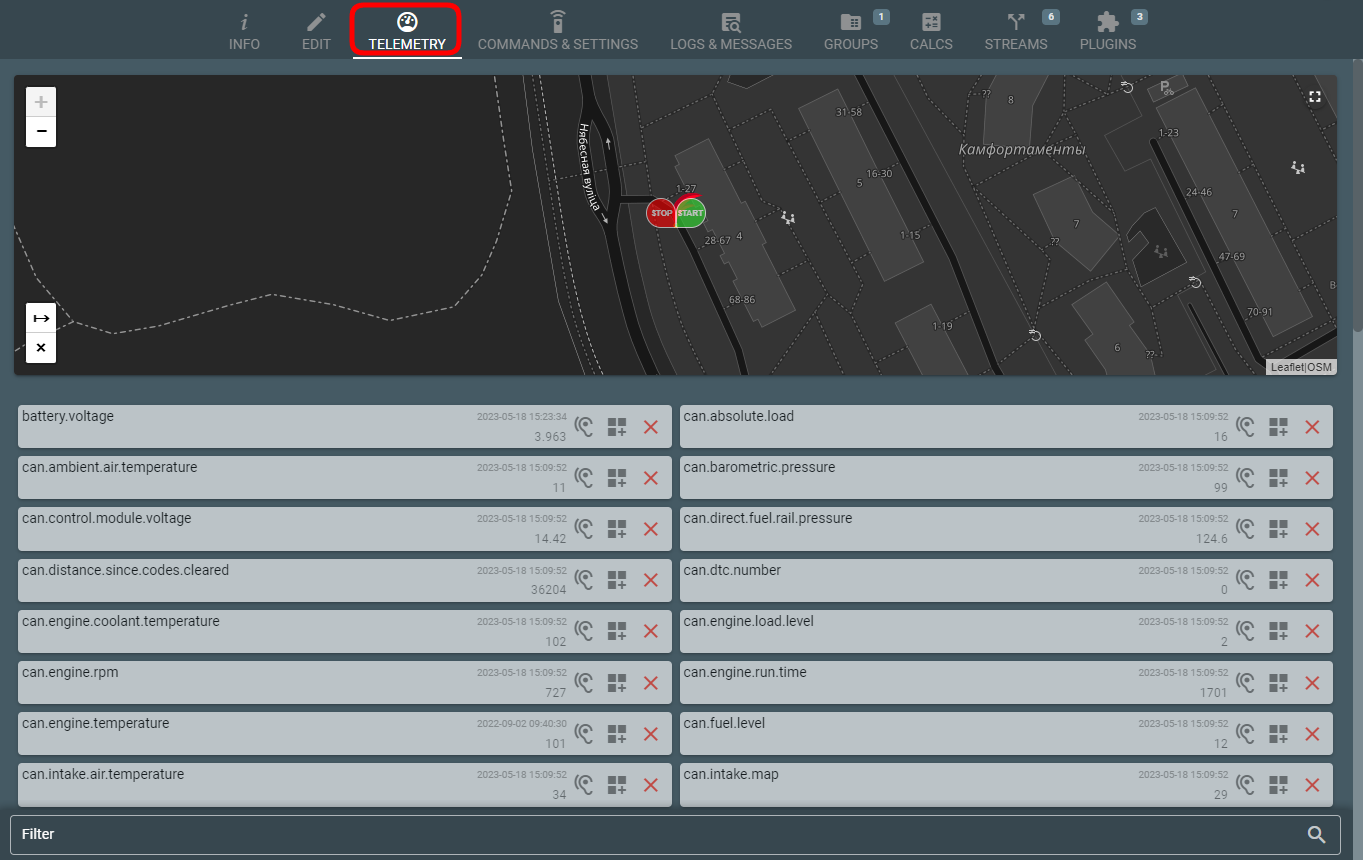
Telemetry tab
On the Telemetry tab for the device, you can see the latest values of all parameters sent by the device and a map with current device position and the last trip:
Command & Settings tab (go to video)
This section is all about device management, and we have a dedicated article about it.
Logs & Messages tab (go to video)
This is the go-to destination for debugging and troubleshooting issues with any item.
Here are some tiny hints hidden in the context menu:
Right-click on the log record and pick “Show on messages” in the context menu to show messages for the respective time period.
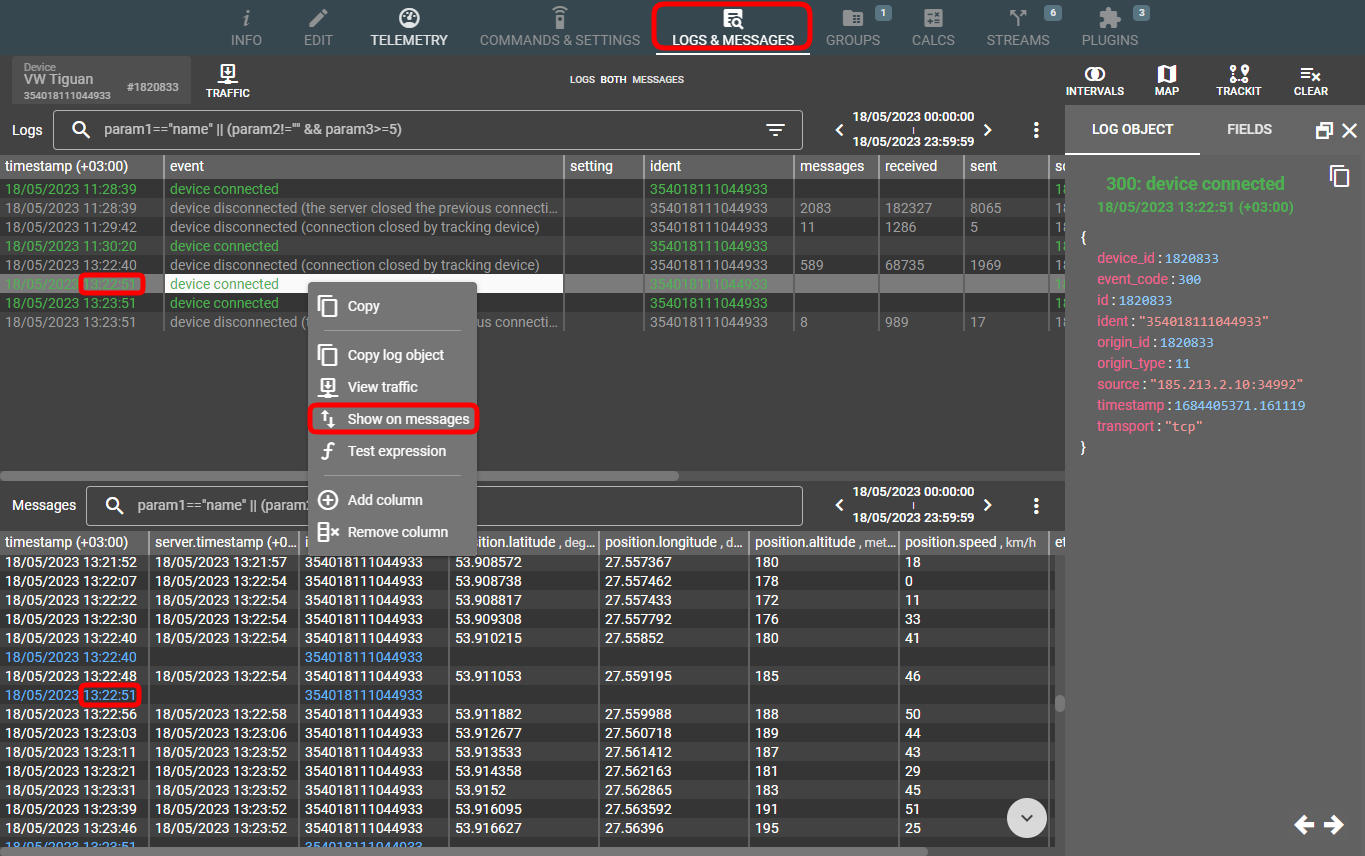
If you want to see the raw traffic for the specific message, just right-click on it and pick “View traffic“.
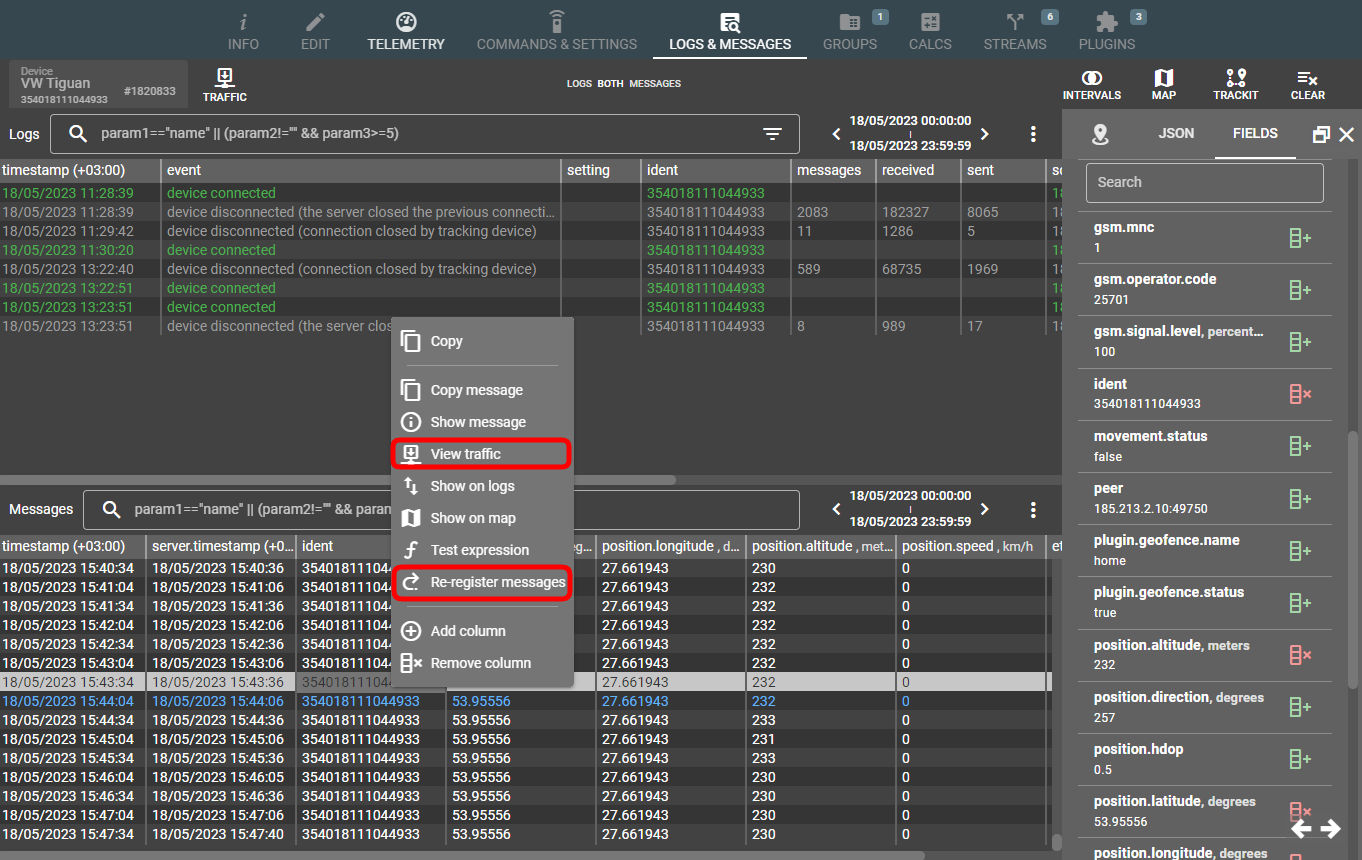
If you want to re-register the message manually (say, not to wait for it to come from the device), you can right-click on a message and pick “Re-register messages” (see screenshot above).
Plugins demo (go to video)
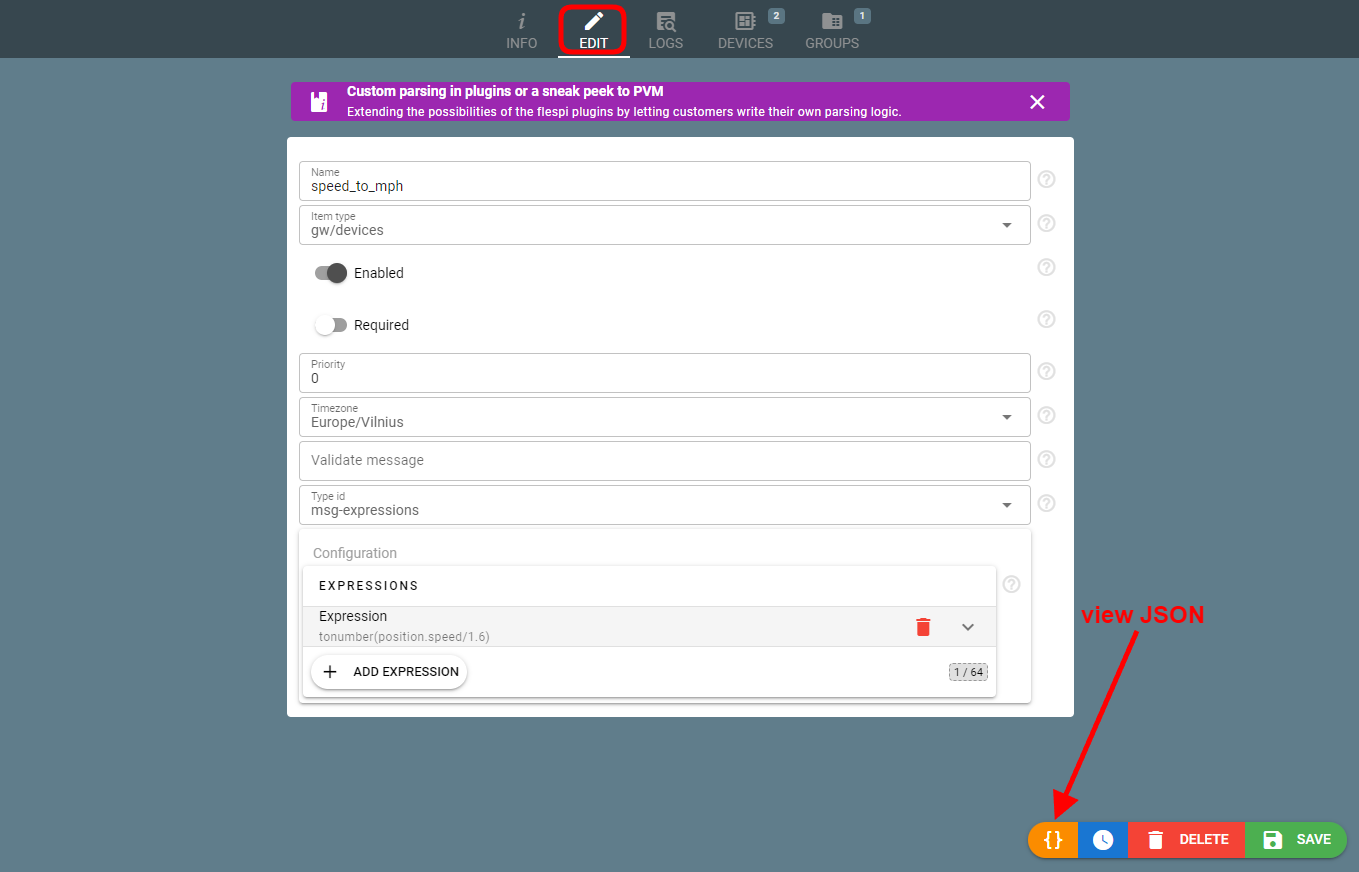
Plugins are a super-powerful data transformation and enrichment tool that allows deleting, adding, and editing message parameters.
One important thing to remember is plugins priority (range 1 to 10) — the higher the number, the earlier the plugin will be applied.
Another tip is how to get plugin configuration in JSON — there’s a curly brackets “{}” button on the Edit tab that you can click to see the code. You can then copy it to quickly duplicate a plugin or create a similar one.
PVM (go to video)
PVM is an internal programming language for protocols parsing. We have a special plugin type to implement this functionality should you need custom parsing.
Streams (go to video)
Streams forward the data into the destination of your choice.
Analytics (go to video)
Analytics offers countless ways to slice and dice your telematics data. You can explore dedicated articles and technical guides for more information.
***
If you enjoyed the webinar, please subscribe to our YouTube channel and turn on the notifications to stay in sync with our new video materials.
Also, you can specify the topics you would like to be covered in more detail in the next webinars in the forum thread (right below this article) 👇.