It was an ordinary Friday with nice, warm summer weather in Vilnius. During lunch at the office, our team members were sharing their plans to spend the weekend with their families and enjoy the outdoors. Nothing pointed to the upcoming catastrophe.
The same day, early in the morning at 01:45 UTC (04:45 local time), there was a short network DDoS incident that was quickly mitigated by our uplink provider, with more serious mitigation measures discussed during the day and scheduled for the following week.
Before that, our previous uptime issues had been on February 2, 2026 – five months earlier. So we definitely felt relaxed. Especially when it comes to DDoS and network connectivity – there isn't that much we can do about it – this is primarily addressed by Zylon Internet Services, our uplink provider for both data centers.
Then at 13:14 UTC (16:14 local time), just an hour before the end of the working day, the second wave of the DDoS attack started, and our infrastructure was still serviced by the same edge uplink routers located on its path. The routing change to use the other side of the uplink connection ring, which we had postponed until the following week, was not yet in effect, so we were once again affected by it. This time, the attack itself was much more powerful, reaching around 60 Gbps of bandwidth and quickly overloading several parties along the uplink path.
Within four minutes of the incident, at 13:18 UTC, Zylon decided to route the traffic through Nawas – the Dutch National Scrubbing Center for DDoS attacks. This decision was implemented within a few minutes, and at around 13:22 UTC, our uptime detection system reported the end of the downtime, totaling 512 seconds of unavailability.
So these 512 seconds – less than nine minutes – were exactly the time it took our uplink provider to mitigate a large-scale DDoS attack. This was an infrastructure problem that was quickly resolved. It was understandable, and it was the maximum downtime our users could reasonably expect from us for a platform unavailability issue that would resolve itself.
What happened next was fully on our (platform) side, and in fact, it was worsened by our own actions.
For years, we had been optimizing platform components for better performance, scalability, and durability, and eventually all of these optimizations instantly led to a cascading disaster. When we initially created flespi 11 years ago, we used PostgreSQL as the main durable storage system for object storage and our proprietary database engine (MDB) for telematics data storage. Later, we implemented our proprietary MQTT Broker and standardized it for internal event delivery between platform components. We also adopted the MDB database engine for efficient storage of retained MQTT messages (topic-based storage – we even coined a special term for it – HASD) and maintained a copy of the PostgreSQL data in MQTT state topics.
Over time, we moved more and more object data into retained MQTT topics as the primary storage because PostgreSQL throughput at our scale is rather limited, even when operating it in sharded mode. Just imagine the device connection status or its traffic counters – small fields for each device – and what happens to them every minute, especially when we deploy updates and devices instantly reconnect. With millions of devices registered and connected to the platform, we are talking about flooding the database system with millions of state property changes per minute. There is no database engine in the world capable of handling such volumes efficiently without overloading the available compute resources. Except, of course, our own MDB engine, which seamlessly processes millions of state changes per second on a single node.
So, step by step and year by year, we moved further and further towards MQTT as the primary storage system, keeping PostgreSQL only for storing important entity information while replicating all the data into MQTT.
To illustrate the modern flespi backend architecture, let me share a slide from this talk:
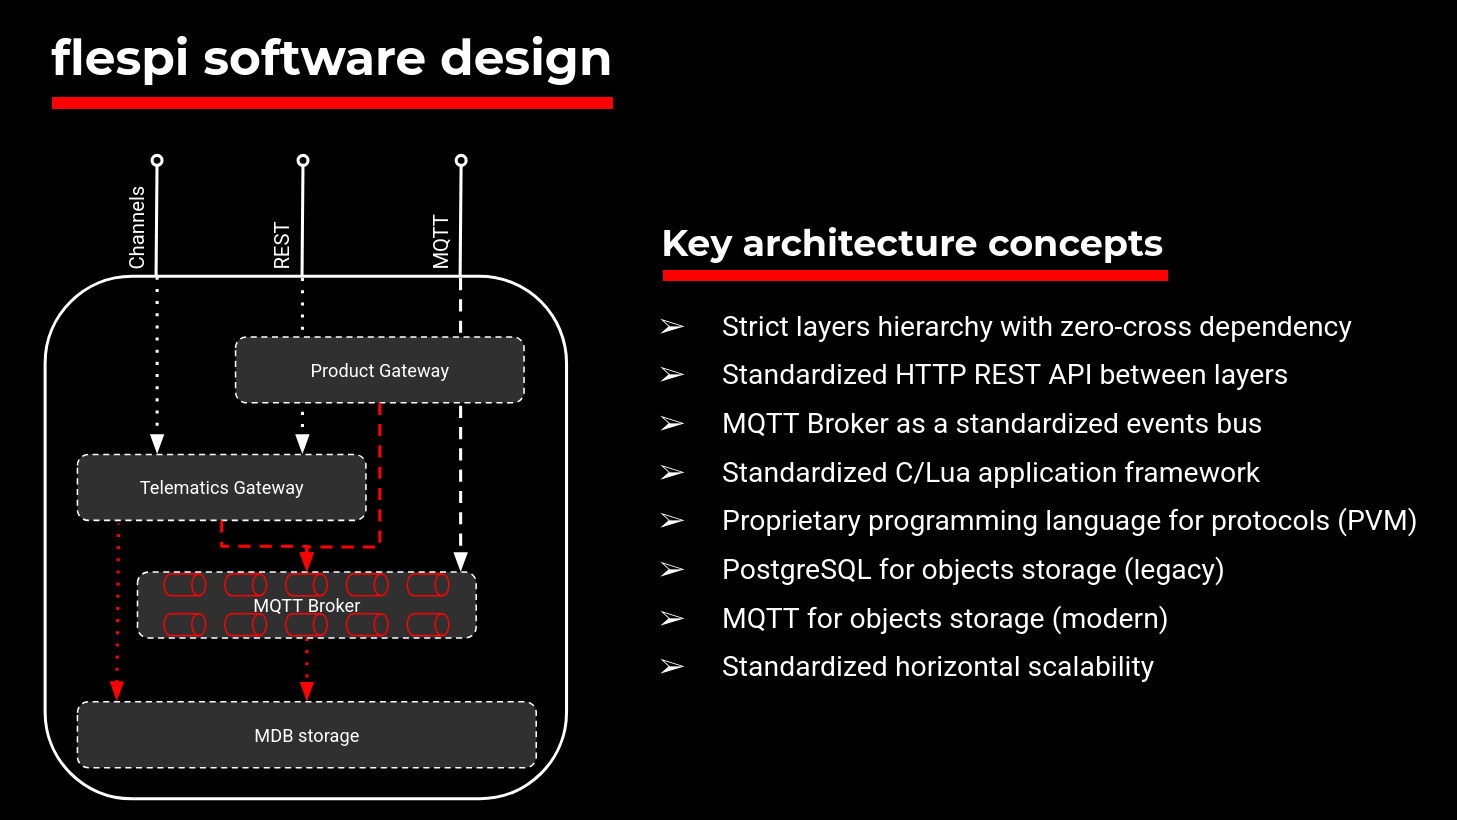
Nowadays, the MQTT Broker, similarly to the MDB storage system, has become a core component not only for event delivery but also for storage.
So when, after a short network downtime, 1.8 million devices reconnected, they started uploading their accumulated message black boxes to their channels, serviced by the Telematics Gateway component shown in the slide above. The Telematics Gateway started uploading them to the MQTT Broker. And at that particular moment, the MQTT Broker was not able to handle the load and became overloaded by CPU usage.
Within a few minutes, we got a cascading effect. At 13:24 UTC – just two minutes after network connectivity was restored – the next downtime was reported. It took 14,816 seconds (just over four hours) until our system became responsive again at 17:30 UTC.
The problem was in the code responsible for cleaning up expired messages within internal queued data structures. The code was originally committed in 2015, and the cleanup itself was not expected to take long, as it checked only the head and tail of the queue. However, in 2017, during the initial implementation of the MQTT Broker, which uses this message delivery system under the hood, we added a callback to the cleanup routine to notify the caller whenever an expired message was removed.
Everything was fine with this code for the next nine years until our MQTT Broker encountered a prolonged period of CPU overload. This CPU overload led to processing delays. The processing delays triggered the expiration of internal commands and delivery notifications between MQTT Broker nodes. And cleaning up these expired commands led to forwarding these events to durable storage, while heavy calls for redirecting events across millions of subscriptions blocked the CPU and I/O loops even further.
But at 13:24 UTC, we were unaware of this, and when a new downtime caused by higher-than-normal latencies was reported, it was more or less expected. At 13:29 UTC, we posted an explanatory message in the NOC about the DDoS attack and temporary issues and waited for things to settle. Internally, we were receiving events from different NOC testing locations reporting either success or problems, with more than 50% of the NOC nodes still experiencing issues. Everything looked more or less normal.
At 13:35 UTC, we started receiving internal alerts about excessive RAM usage on certain servers, which looked suspicious, and we began investigating what was going on.
At 13:38 UTC, we got the very first message about an MQTT Broker node outage caused by CPU overload with locked I/O. Our application framework automatically produced a core dump and printed the call stack. This was the very first signal that something unexpected was happening, and it was not a good one.
To prevent service crashes due to a lack of RAM, at 13:39 UTC, we initiated the MQTT Broker node restart process. It took a long time to shut down the nodes one by one, and we eventually cancelled the operation. Whatever nodes had already restarted dropped the existing sessions for all subscribers and forced them to reconnect, which in turn increased the load because during session initialization we either restore existing subscriptions or re-subscribe. So the CPU load on the MQTT Broker increased as a result of our own actions.
Even more, some of the restarted MQTT Broker nodes were unable to complete the initialization process because they are part of a global system, and the running nodes were unable to serve them. In an attempt to restart the Broker, we ended up with an inoperable system. However, we were unaware of this because the restart process was slow and running in the background, and we didn't push it too hard at that moment. Plus, of course, there was too much noise (various events) across all infrastructure channels.
At 13:56 UTC, we received another batch of events reporting non-responding MQTT Broker worker nodes, which was urgently addressed at 14:05 UTC by increasing the interval for checking expired messages from one to ten seconds. We deployed the fix immediately and started upgrading the Broker nodes with it the very same minute. This was exactly the moment when the upgrade was initiated in a hard parallel manner, and we discovered that we were unable to start the Broker system with so many consumers.
As a result, at 14:15 UTC, we made the decision to shut down all MQTT-heavy subsystems. We started stopping the REST API gateway, the streaming system, flespi analytics, the Telematics Gateway with both its REST API and channel processing components, and the external customer-facing MQTT Broker gateway to prevent any external connections to the Broker. We stopped everything, and at 14:23 UTC, we once again attempted to start the MQTT Broker. The MQTT Broker nodes started more or less correctly, and at 14:33 UTC, we began the graceful restoration of all stopped services, except for the channel processing system in the Telematics Gateway, which we decided to leave stopped and activate at the end.
At 14:47 UTC, we decided to reset the local state cache on the Telematics Gateway REST services to force a state reload from durable storage and deployed the fix, restarting the services once again. That turned out to be another mistake, which not only resulted in a long startup delay but also, due to timeouts and network bandwidth overload, left us with a partially incorrect state. Moreover, some cleanup jobs designed to run on the primary Telematics Gateway node were activated while it was only partially loaded, which led to an inconsistent REST API service state. On top of that, the recycle bin cleanup procedure started deleting intervals in the analytics system. We were unaware of these issues at the time.
At 14:51 UTC, we started deploying additional MQTT Broker nodes on nine new servers. We were preparing to reopen the channels. At 14:58 UTC, we once again received the blocked I/O loop events from the MQTT Broker and decided to address the issue in the code. At 15:22 UTC, the fix in the core event queue system was implemented to drain the expired message queue according to the CPU time budget.
At 15:24 UTC, we started deploying this fix to the MQTT Broker. By 15:47 UTC, all Broker nodes had been upgraded. And this is actually the code that fixed the whole issue. From that moment on, the MQTT Broker operated smoothly.
Immediately after, we once again restarted all MQTT client services to ensure their state was correctly initialized. It took quite a while for the majority of services to settle, and at around 16:23 UTC, we started activating more and more Telematics Gateway services responsible for channel processing, keeping the window narrow enough to prevent the MQTT Broker from becoming overloaded.
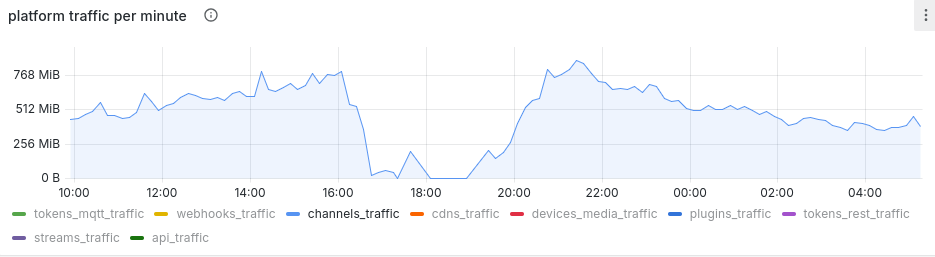
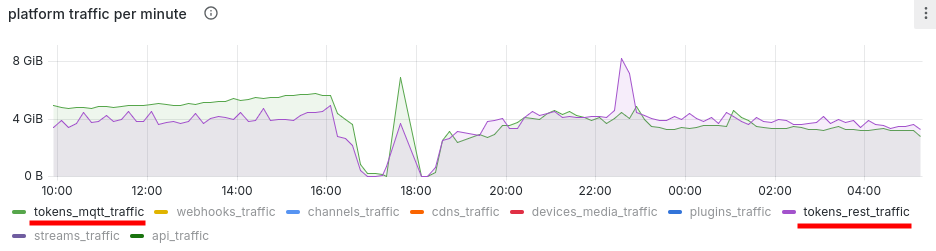
At that moment, the downtime was still active, but the actual data processing pipelines were already operational, although slower due to the increased load. Unfortunately, our statistics gathering system ingests data via MQTT and was also affected by this outage. However, the overall timeline can be seen in these two charts (rendered in local Vilnius time – UTC+3).
Channels (actual data between telematics devices and flespi) traffic per minute:
MQTT Broker and REST API (external flespi consumers) traffic per minute:
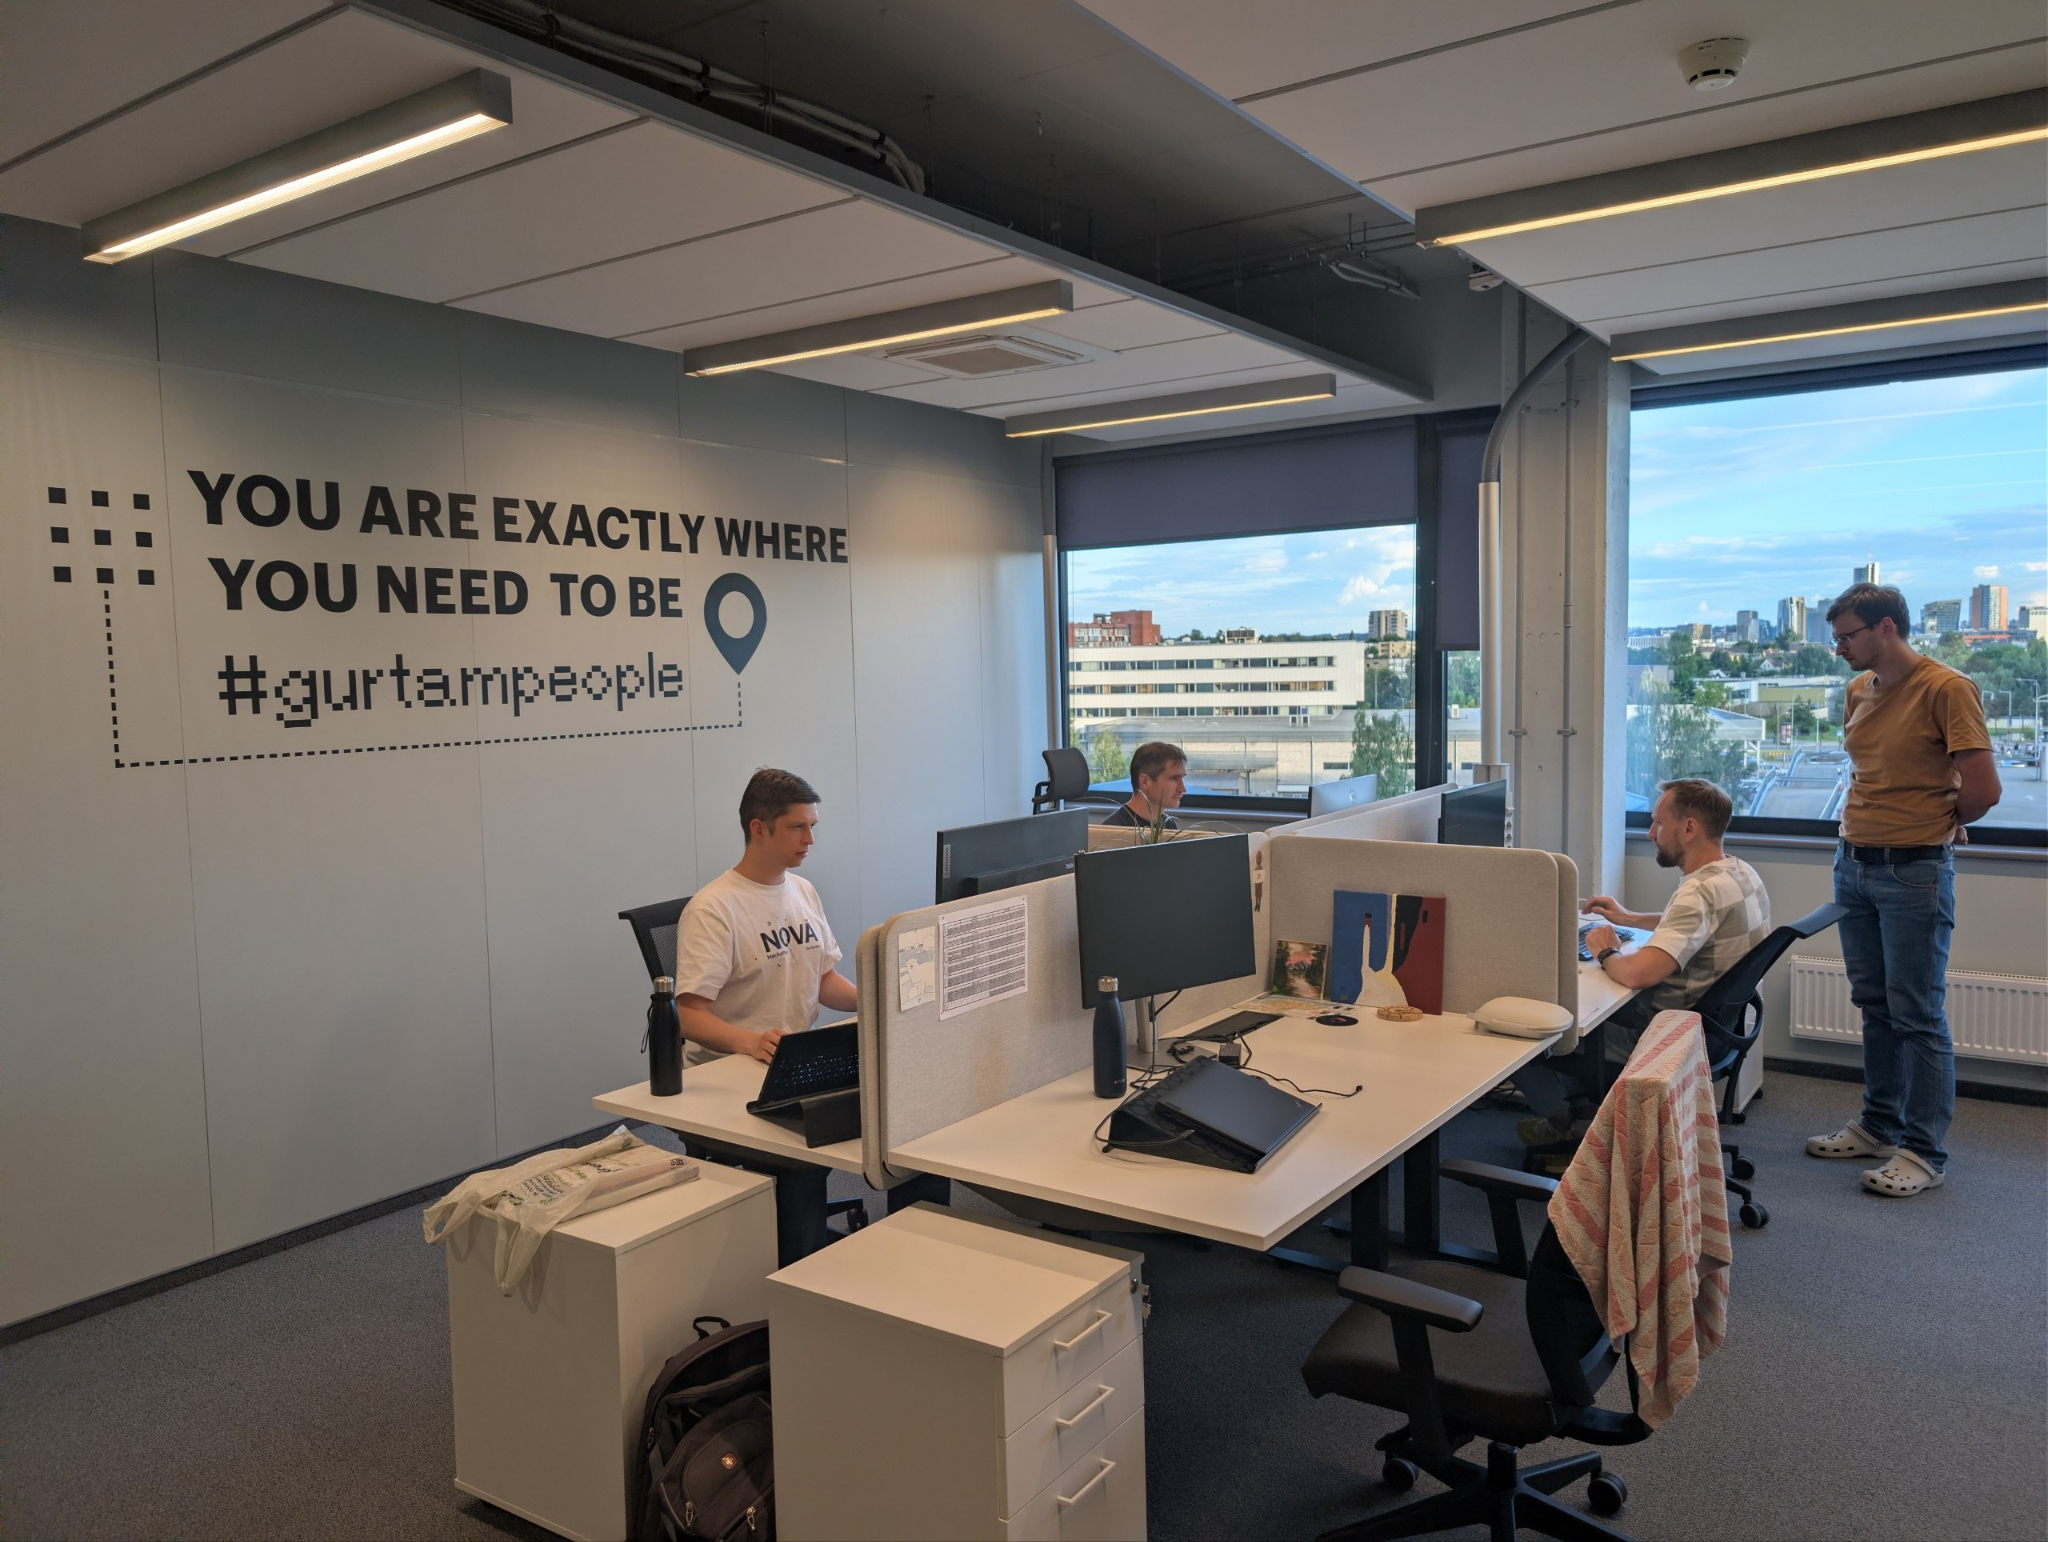
At 17:30 UTC, the downtime finally ended for the first time, although it was followed by a few more short interruptions. That was a hard moment, but all systems were running, so we simply waited for everything to settle while also checking data consistency across the services. We even managed to take a more or less relaxed picture at that moment:
At 18:04 UTC, we posted an initial notification that everything was OK with the platform and that we were checking all the systems. We were still hoping to spend the evening with our families...
However, a few minutes later, we suddenly discovered a side effect of the outage – our primary Telematics Gateway service, while in a half-initialized state, had decided during the regular recycle bin cleanup procedure that some device-to-calculator assignments no longer existed and initiated their deletion from the database.
Don't even ask how much hair turned gray when we discovered this. It was quite a shock. A good illustration of this, including our restoration process, can be seen in the chart below:
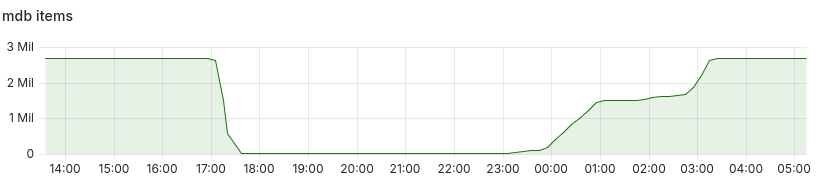
At 18:41 UTC, we reported the problem in the NOC and started the interval recovery process. We had part of the data directly on the interval processing nodes and most of the data in stable backup storage, although some intervals there could be stale.
Around 19:00 UTC, when it became clear that the whole evening was ruined, we briefly discussed ordering pizza. Nobody was in the mood to eat or even hungry, so we dropped the idea and continued engineering the interval recovery system.
At 20:00 UTC, we implemented a dedicated system for restoring intervals from the processing nodes and started rolling it out gradually, keeping the database load under control. After it had been running on a few nodes for about a dozen minutes, we finally reduced all timeout intervals to increase interval upload throughput. In parallel, we started working on a scripting system to upload the remaining intervals from backup.
At around 22:00 UTC (01:00 our local time), the initial interval restoration process from the processing nodes was complete. We had uploaded everything available there. Then we started the restoration process from backup, which took quite a while as well.
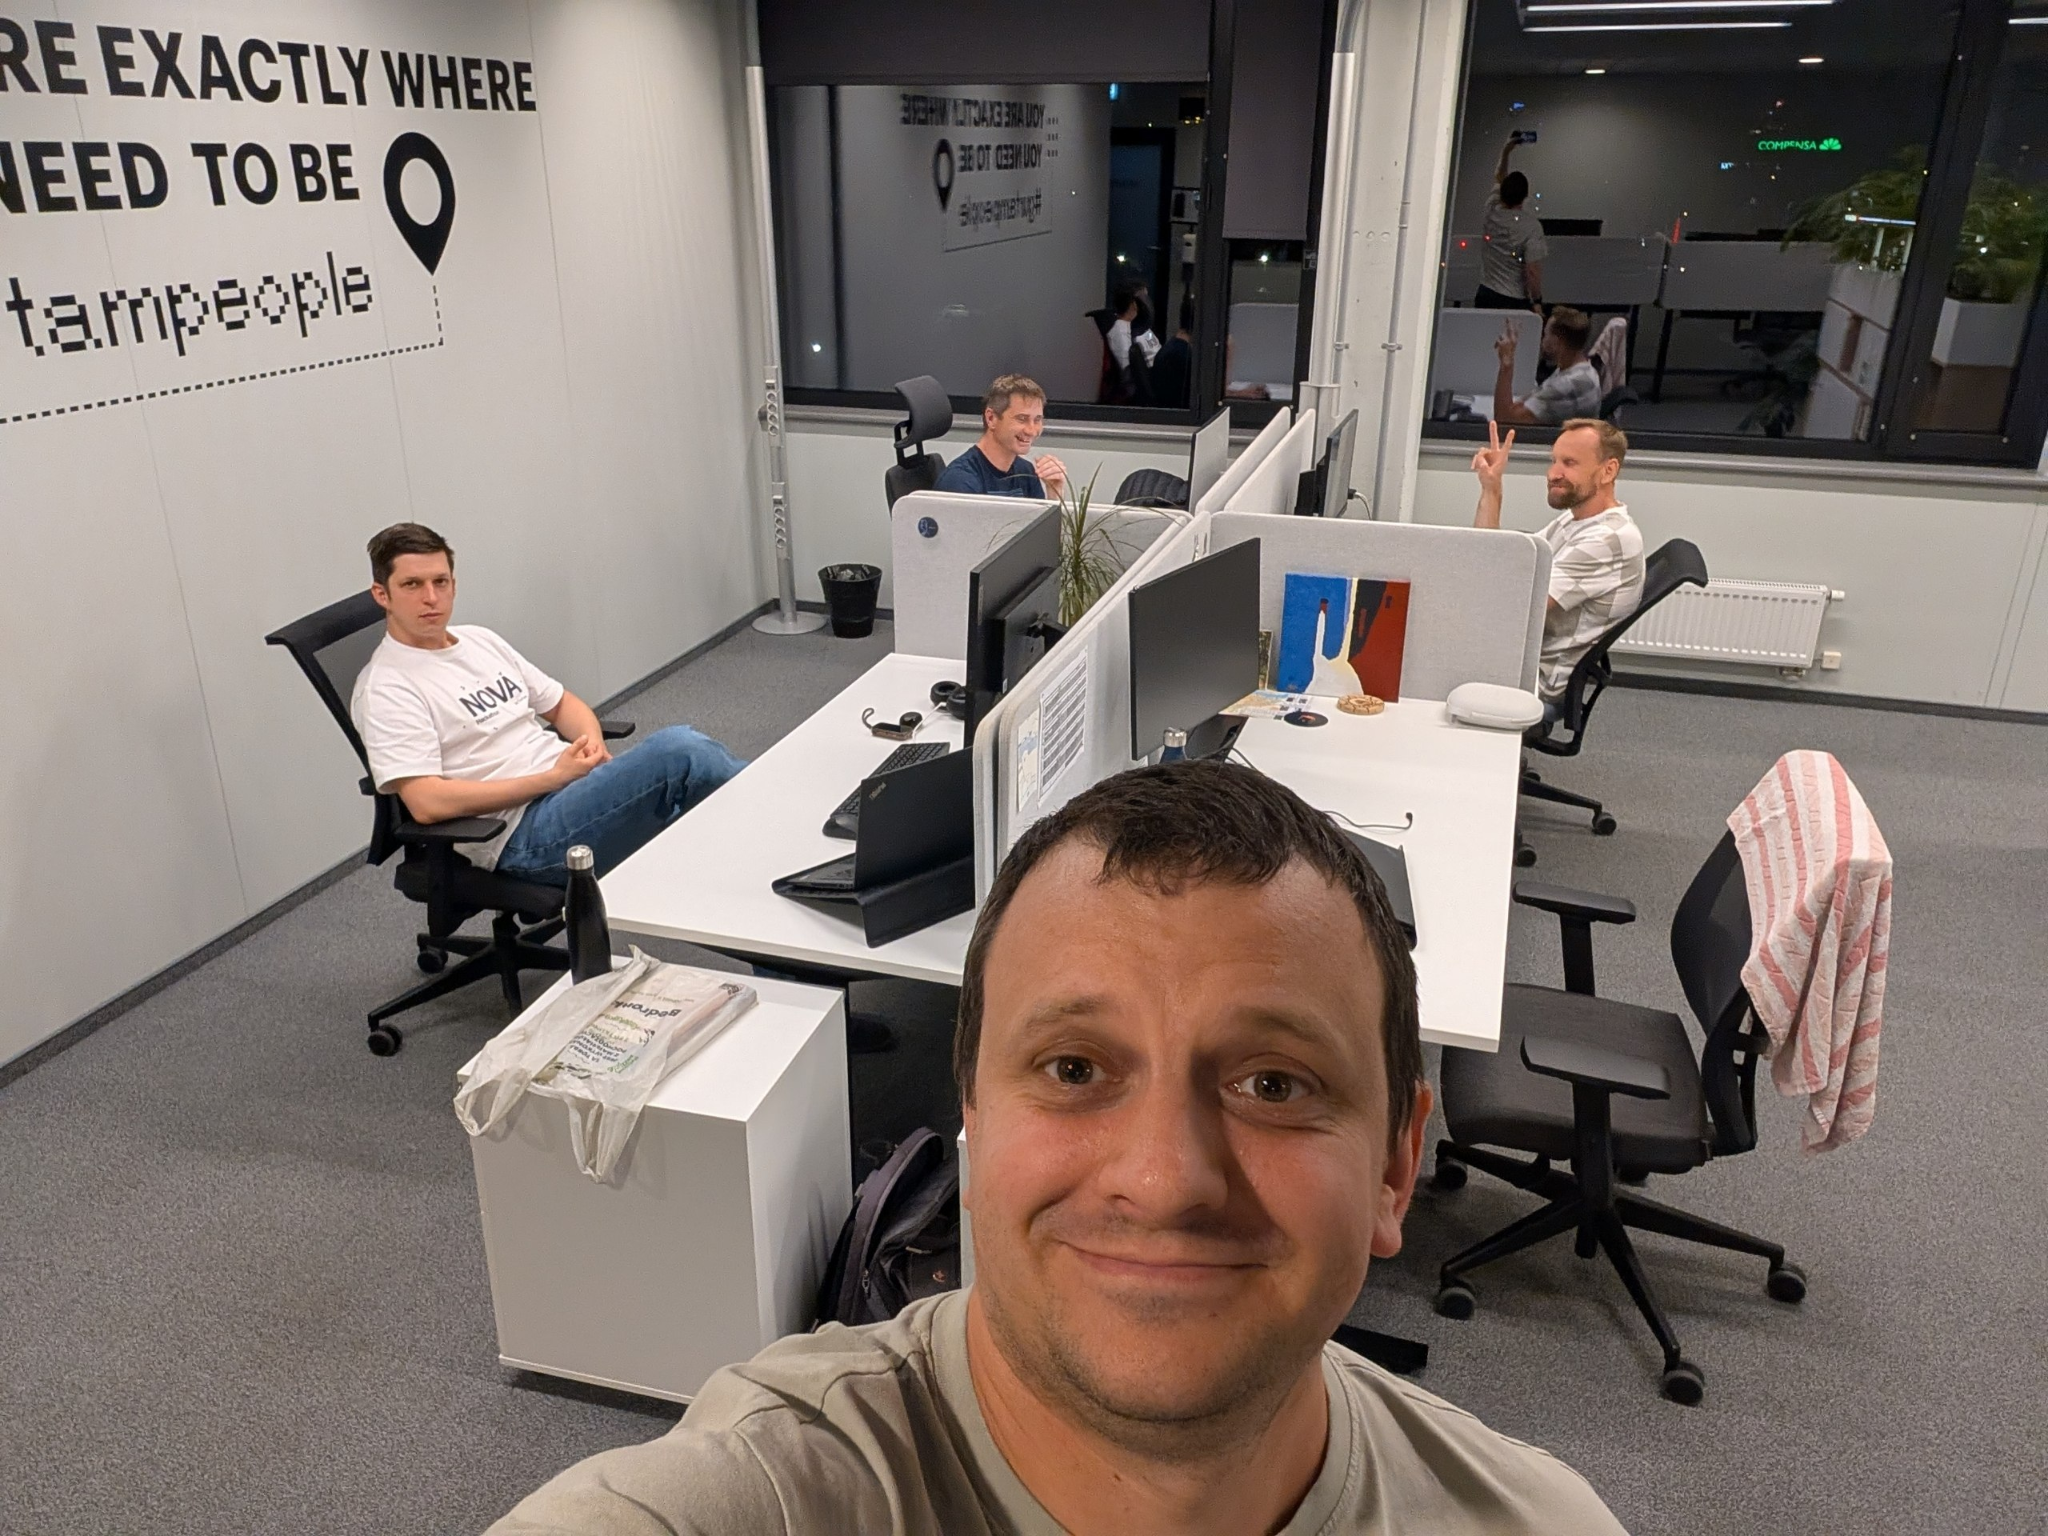
During this process, our mission was simply to wait. So once again, the question of food came up. We were completely exhausted, and this time ordering pizza sounded like a much more reasonable idea.
At around 22:44 UTC, we finished the script and started the interval recovery process from the backup system.
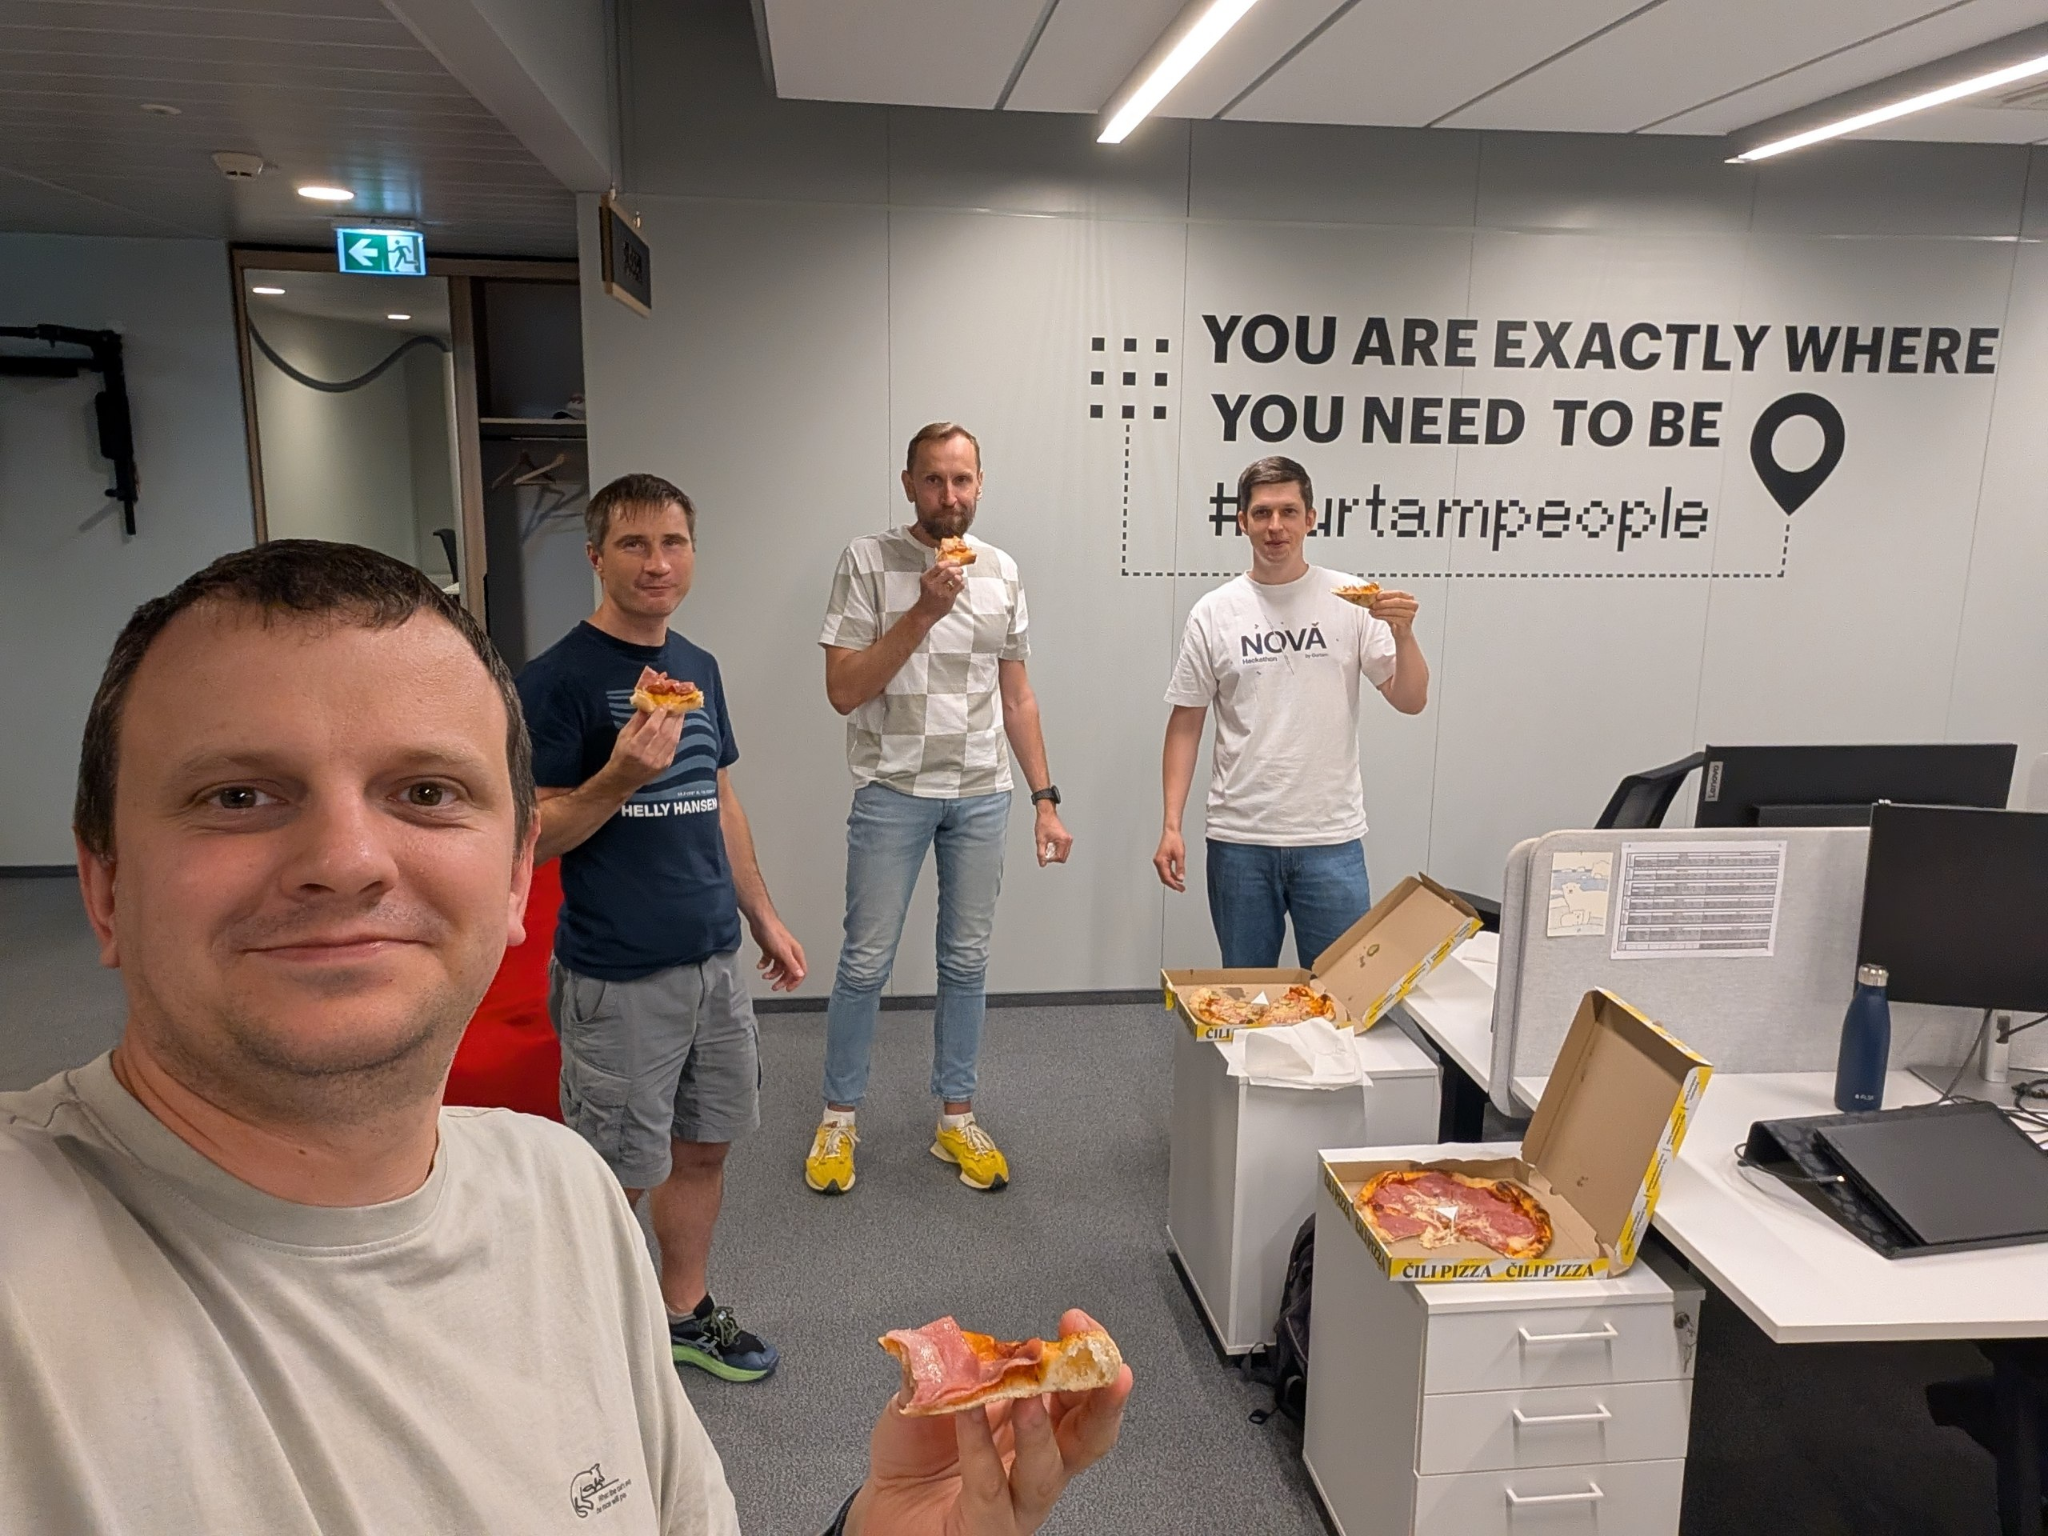
At around 23:00 UTC, the courier delivered the pizza, so we finally had our dinner:
At 01:00 UTC (04:00 in our Vilnius HQ), all analytics intervals had been restored, and we finally left the office and headed home.
On Saturday and Sunday, and to be honest, for the next two weeks, we continued working on this incident, addressing every inconsistency or performance issue we were able to detect over time.
At the bottom of this outage lay a single reason – the human factor – the decisions and actions made by the team under stress in an effort to stop the downtime counter as quickly as possible. And, of course, there were all the years we had spent squeezing more and more performance, efficiency, and durability out of our system, gradually turning the MQTT state system and the Broker serving it into a single critical point of failure.
We are still working on this – investigating possible failure scenarios, measuring service performance degradation during various types of outages, and how they could affect us. And, of course, we are improving our platform architecture to prevent similar incidents. You know, it's always the tiny adjustments that result in major improvements. That's exactly what we are doing now, and later we will consider more strategic architectural improvements.
The most important lesson I think we learned, in case the same situation ever repeats, is that we need to stay disciplined and, instead of restarting services or widening the Telematics Gateway window to handle more traffic, keep it narrow enough to prevent any internal overload. It's not a problem to have a delay of six seconds or more in device message reception or command delivery as long as the platform itself remains operational. This would still count as downtime for us, but for many of our users it would simply mean a degraded experience, nothing more, and certainly not a complete outage like the one we had this time.
And in the end, I would like to highlight the positive discoveries we made:
For the database system, this incident and the interval recovery process passed completely unnoticed. We had invested a lot of effort into making it extremely stable, and it truly was.
At 16:58 UTC, during the downtime, we received a commercial upgrade request, and one of our users paid through the deposit link and activated a commercial account with us. In the middle of a multi-hour outage, this was incredibly inspiring. Thank you so much, dear user, for your support!
Many of our users were chatting with Codi (AI). It had direct access to our NOC system and platform status page and actively kept them informed about the outage. Codi helped us, but after reviewing the conversations, we also realized how supportive and kind our users had been, wishing us strength and encouraging us throughout the incident. Thank you, dear users. We truly appreciate these messages, and we promise to do everything we can – and even what seems impossible – to prevent an outage like this from happening again.
And, of course, there's our team and the way we handled the incident – splitting responsibilities, staying in the office until 04:00 on Saturday, and working through it together. That, too, is an unforgettable experience.
It was the biggest downtime in our history. Our monthly uptime for July dropped to 99.3847%. As part of our SLA, our Ultimate users automatically received a 70% discount, while our Enterprise users received a 30% discount.
And once again – our sincerest apologies to all our users for this outage.