Following are the steps to see the flespi platform in action.
1. Create a flespi account
Go to https://flespi.io and create a free account by authorizing with one of the social networks or registering via email.
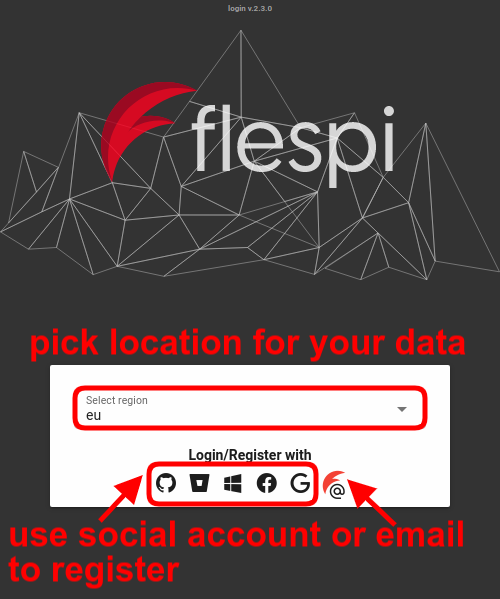
Free account allows you to create a fully functional solution and test all flespi features in action. The account can be used for as long as you need — no demo period or trial limitations.
Note: flespi will delete your Free account after 60 days of inactivity.
2. Create a test channel
Go to Telematics hub -> Channels -> ‘+’ button in the bottom right corner and fill in the new channel name and pick “test” for protocol_id. Then click Save.
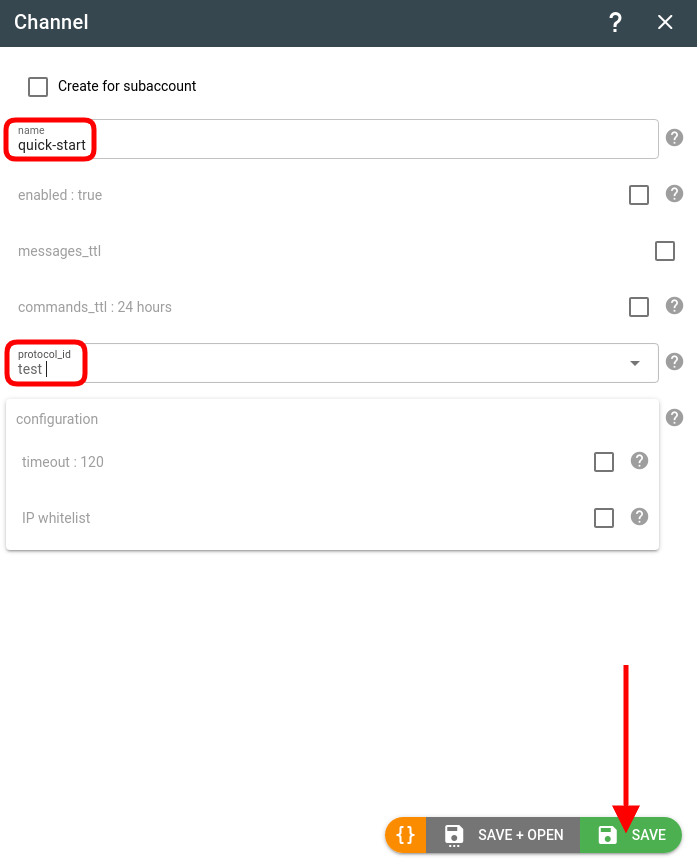
Every manipulation with flespi can be performed via API. Channel can be created with this API call.
3. Connect to the test channel
Open telnet connection to the domain name and port specified in the channel card.
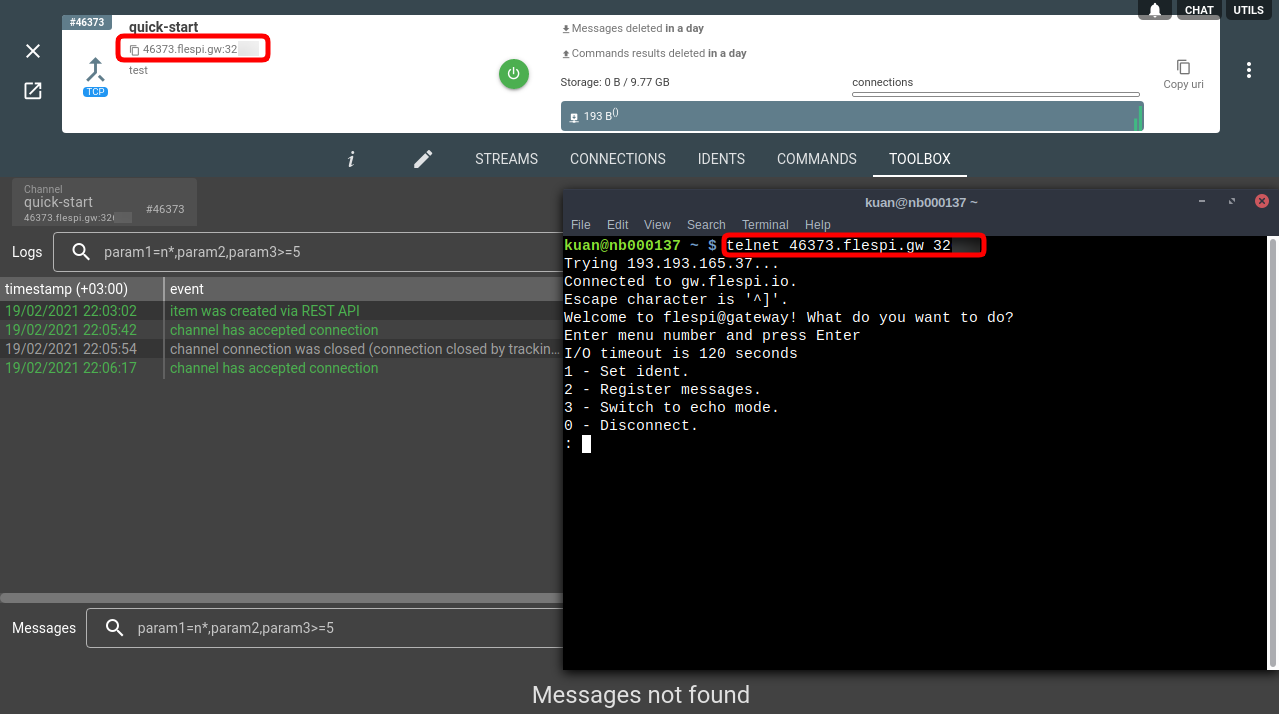
Each channel has a unique domain name and port. That gives you the power to debug and analyze each part of the channel operation: manage connections, see logs and messages, send commands to specified connections.
4. Emulate device work
Test protocol provides several options:
- Send ‘1’ to set the device identification string. This emulates the initial package from a tracking device.
- Send ‘2’ to type a JSON message to be sent to flespi. This emulates sending telemetry data.
Open the device Toolbox tab to check the result.
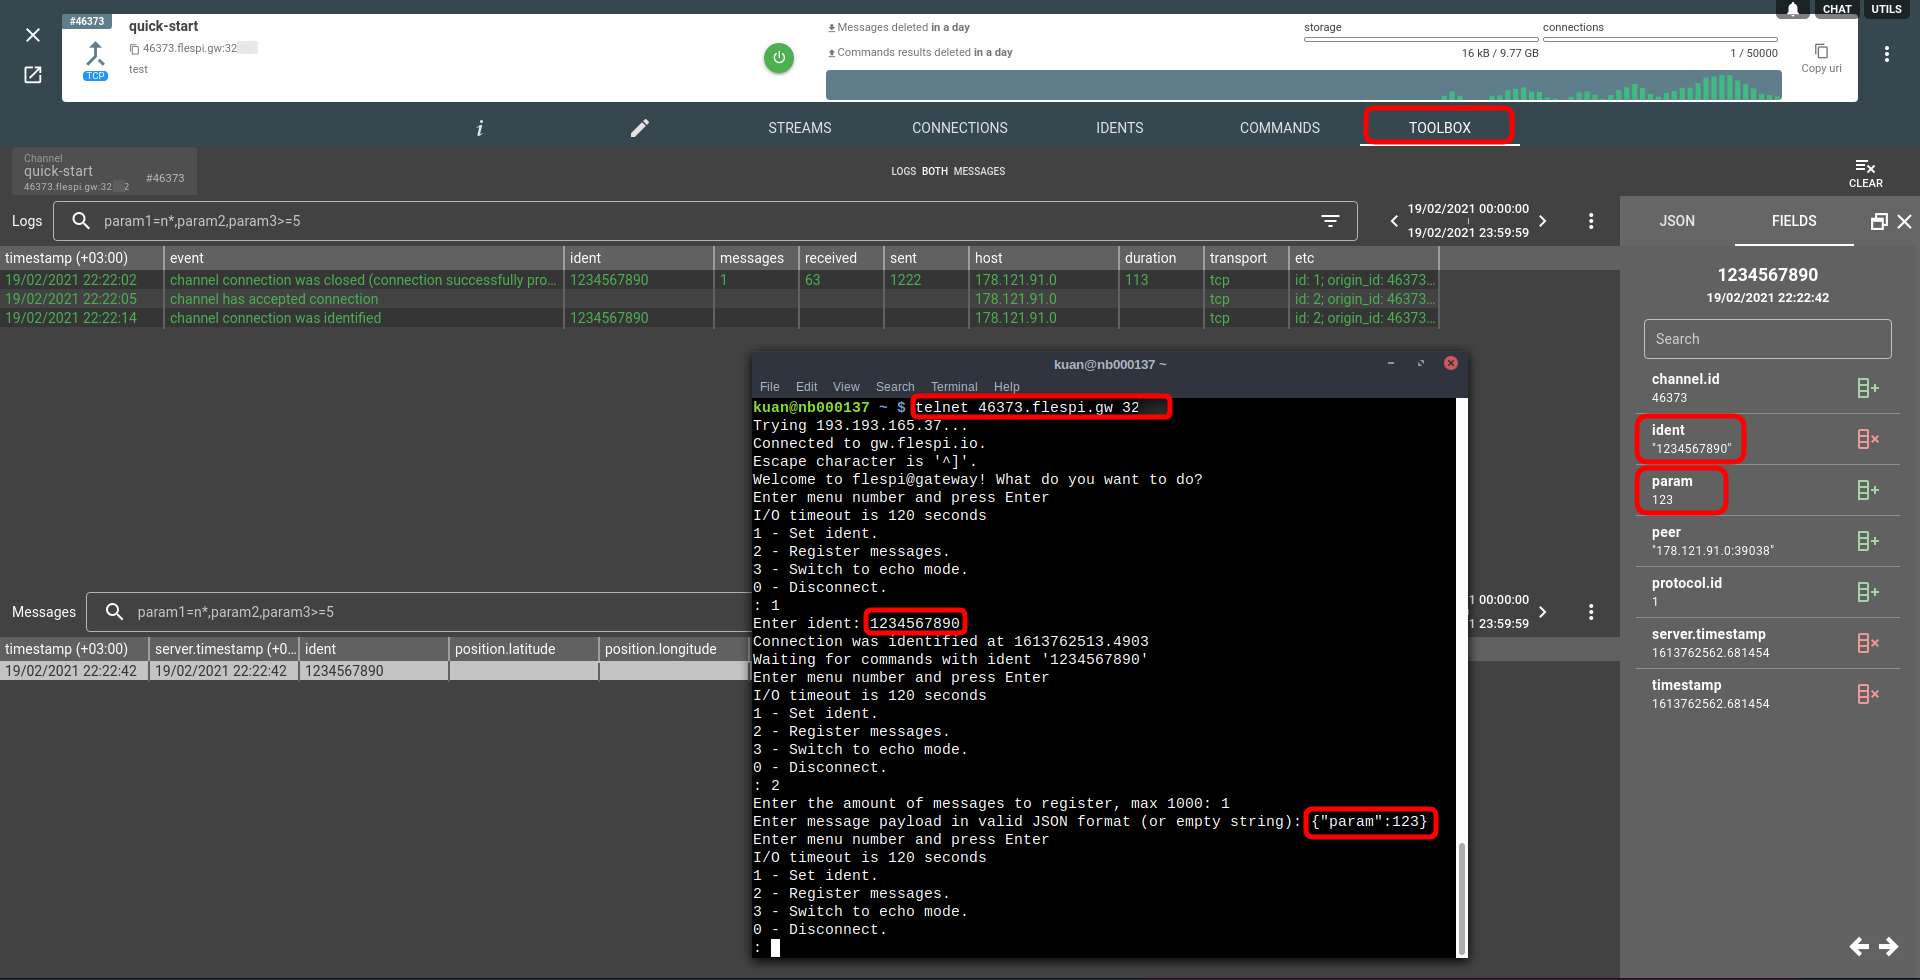
In a free account one channel can handle up to 5 simultaneous connections.
Conclusion
This was an emulation of sending telemetry data from a tracking device to the flespi platform. The next step is to connect real tracking device and embed the unified data from flespi into your application with flespi API.
Before you will start integrating flespi we suggest to watch detailed videos from our conference. Invest your time into watching them to save much more time and money later, when you will implement your project: