List of topics we’ve previously covered on flespi conf 2023:
Earlier this year, we hosted a webinar dedicated to UX/UI tips because the design itself evolves, and, secondly, there’s nothing better than having both front-end and back-end developers together in one place. Devoted to the flespi interface, it’s probably the reason you’d prefer watching once rather than being told twice.
Human nature craves visualization, and while developing our platform, we pay a lot of attention to making it user-friendly yet responsive to your needs, simplifying the process of managing data to its simplest representation. Some of these elements are familiar to you; the rest are still pending clarification in our Helpbox sessions, so we've decided to address them. Let’s see how we take shortcuts in our work while solving your requests.
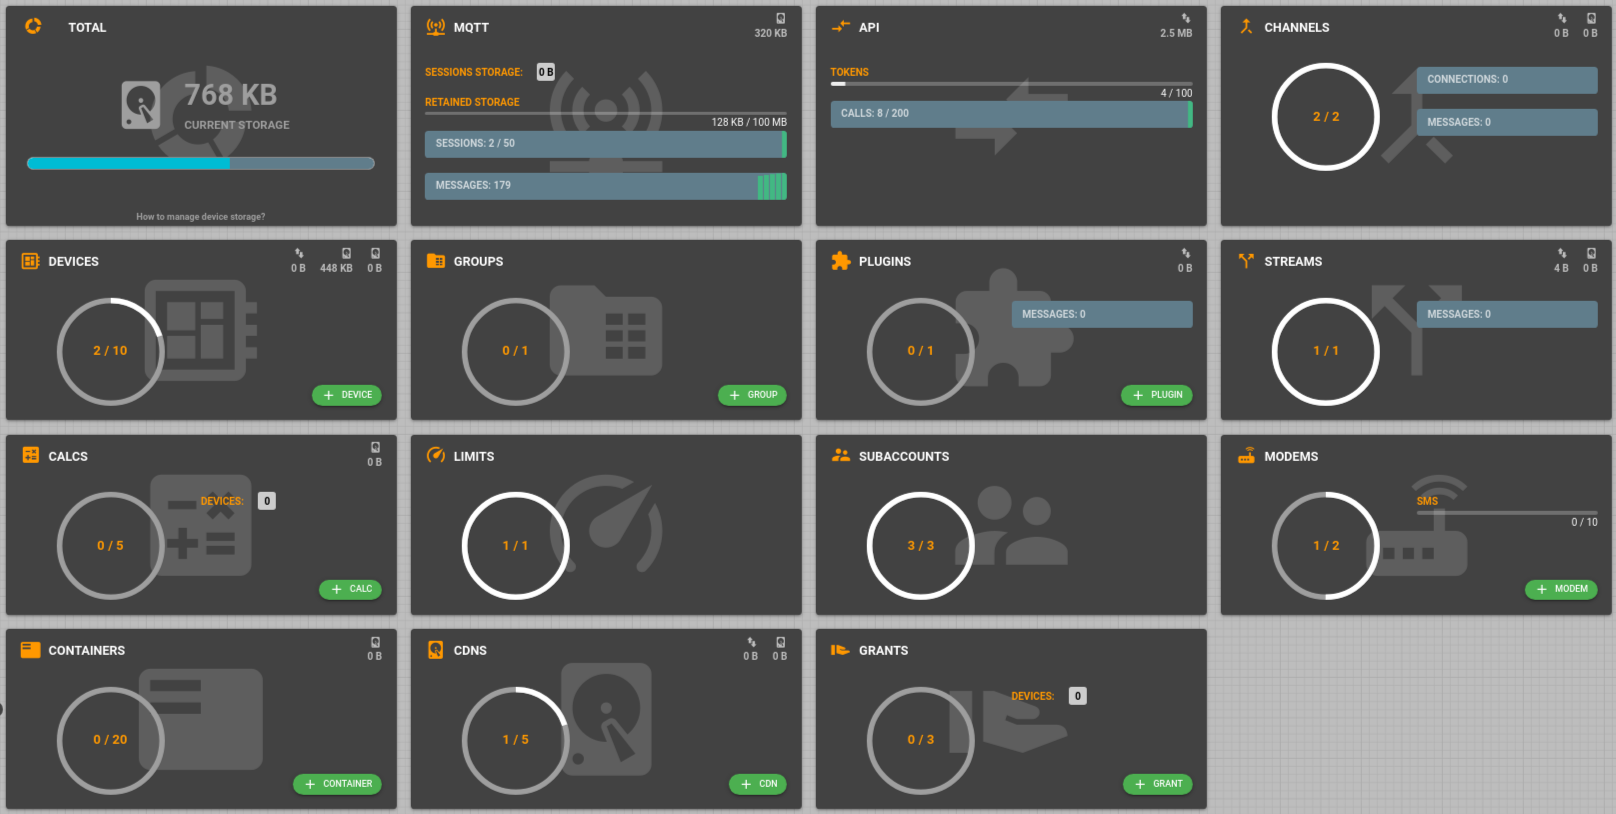
The dashboard obviously contains a lot of actual data, providing you with an overview of main entities and their values (clicking on them opens another shortcut tab). Clicking on the account name allows you to check billing options and invoices issued - this is set to provide maximum transparency (by the way, here’s the link to read about how flespi billing works, in case you think you’ve been overcharged). As you navigate through the other panels shown on the main screen, you can easily exclude some of them. For instance, disabling Storage enables you to monitor only values that require your regular attention. The "running man" icon can simplify the lists of devices, especially if you have hundreds and hundreds of trackers, or you can subscribe to our change logs to follow the latest improvements made regarding a specific protocol.
Exploring channels, you can access a global list of them but it's not the end. E.g. if you want to investigate which protocol can report the 'engine.temperature' parameter, you can display a list of protocols by filtering this parameter from the list.
On the MQTT tab, let's consider a Teltonika channel, which includes all the topics this channel is responsible for. As a matter of fact, we've implemented a nice feature to open an MQTT board displaying the hierarchical structure. For example, the ‘Idents’ tab is one of the places to create devices in bulk or with a webhook, guiding you through the process step-by-step.
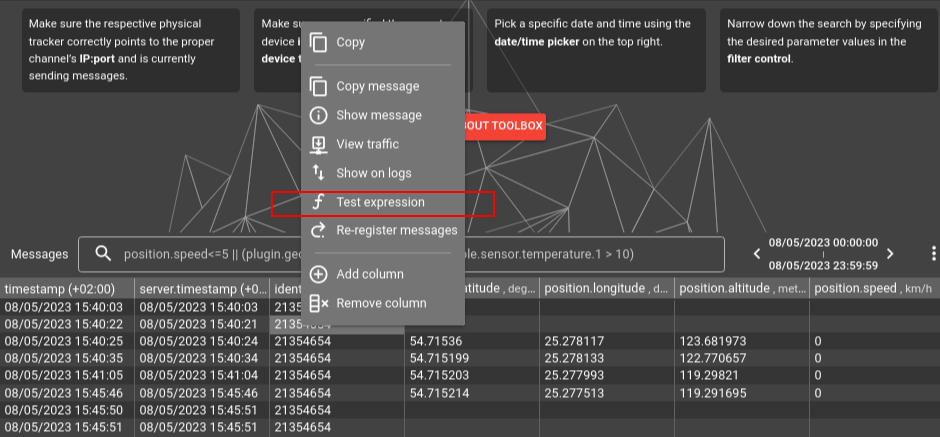
‘Devices’ lead us to the Toolbox - a visualization hub where you can spend most of your time exploring either the Log or Messages panes, with messages continuously streaming. You may copy an object or its ID to get exact traffic in binary form. Once here, you're free to rearrange the columns as well, removing unnecessary ones and adding additional ones, while filtering the logged data for a specific request you’re seeking. Pay attention to the color scheme as it helps you quickly identify issues. Opening a device, right-click to try out our Expression tool, which is extremely useful for checking syntax and getting instant results - expressions are widely used in streams, counters, plugins, calculators.
Navigating to 'Telemetry,' you're presented with the last values received by a device, along with various actions to perform. Here, you can again create a webhook and subscribe to a topic. With MQTT board you can also test and launch a widget in MQTT Tiles. This allows you to visualize the vehicle's position on a route, updated on-the-go with a shareable link, ensuring the status is clear to your customers. Did you know there's a history archive in case you've mistakenly (or intentionally) deleted a value? Rest assured, it will be recorded in a ‘Platform’ log along with every action performed by anyone who accessed the settings. Matching a token ID with an IP address isn’t tricky, making it easy to investigate what's gone wrong.
Every device has its dedicated page with a changelog, providing a link to the forum to keep you informed about the updates we make. Concerning the list of devices, here you can right-click to retrieve details of each device and open it in the dashboard.
Tokens play a critical role in access management, so it won’t be too much to recap. Plugins have been covered before, but primarily this video focuses on use cases. For instance, using retrieving drivers' names and license plates to store in the message as strings, or utilizing flespi in general as an expandable database for analysis.
Now, let’s delve into more(!) complicated scenarios. What if each message should have a physical address? We're listening to our customers and we're implementing the most trending geolocation services (LocationIQ, Gisgraphy, etc.). However, the plugins work only with new messages, but once stored, the messages can be posted and enriched with the 're-register' option. When you return to review them, you'll notice blue-colored lines, indicating they've been manually added (marked with REST timestamps corresponding to server timestamps).
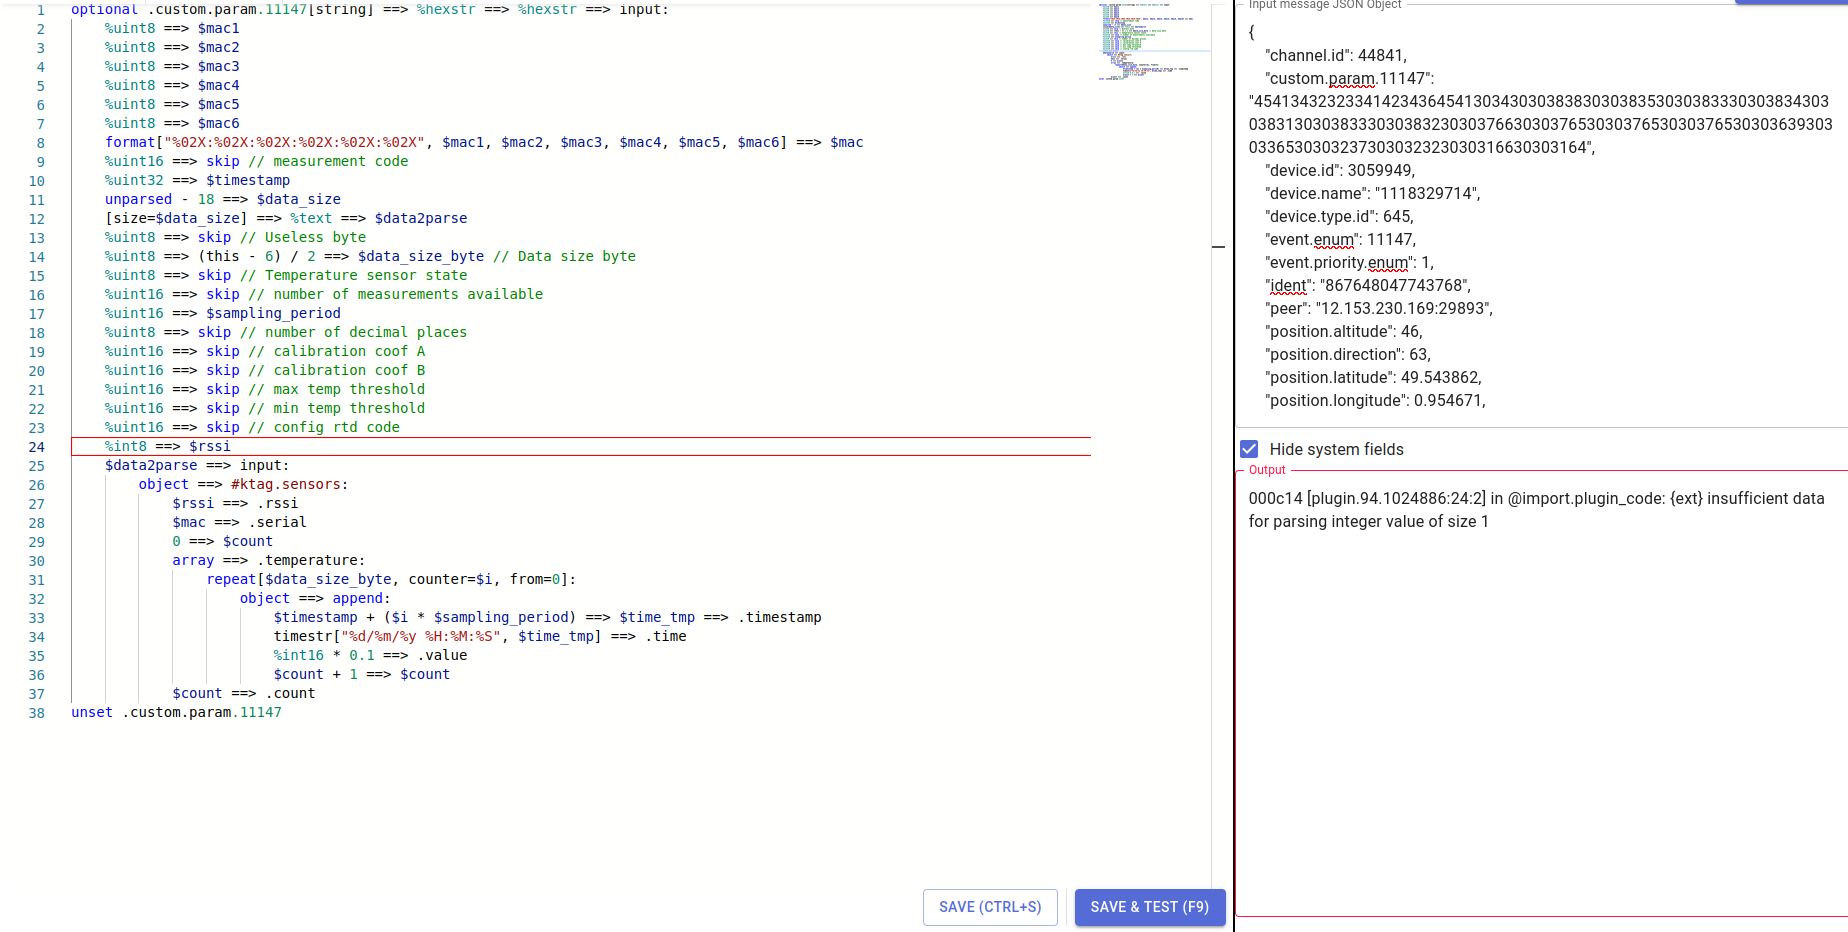
However, nothing compares to the power of the PVM plugin, which allows you to create some custom parsing on plugins. Welcome to the PVM plugin sandbox - here you can really turn on 'god mode'.
Calculators provide another way of solving trivial tasks like splitting the message flow by days or going down to counting daily mileages. Though calculus itself may sound complex but still calculators truly simplify your platform journey, especially when performing more complex algebra with merging intervals and setting maximum interval duration. However, it's time to focus on the presentation rather than diving into complexity. :)
Next time, we'll wrap up our flespi conf 2023 videos with our final presentation about Flespi as a Data and Integration Hub.