Essentials
This article contains the description of flespi API usage. Key points:
-
There are 2 types of API: HTTP REST API and event based MQTT API
-
Flespi UI is built using API: everything you see in flespi UI can be embedded into your solution over API
-
API usage is authorized by tokens
Here is the short overview to quickly compare REST and MQTT APIs:
|
|
REST API | MQTT API |
| Recommended for |
|
|
| How to test |
|
MQTT sandbox - MQTT Board  |
| Hint in UI |
 |
 |
| Authorization | Flespi Token in Authorization HTTP header | Flespi token in MQTT session username or password |
| Usage logs | Platform logs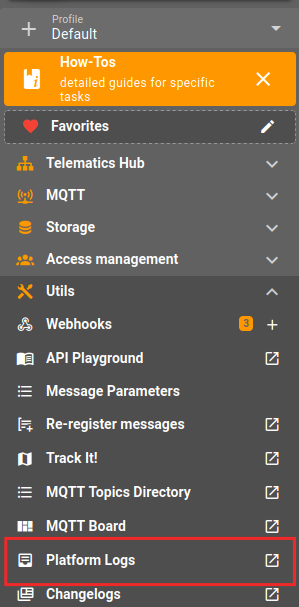 |
MQTT Sessions and Logs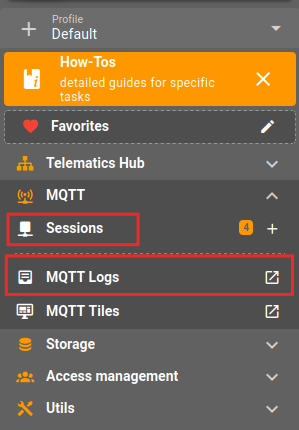 |
REST API
HTTP REST API call consists of: method, headers, URL (with optional query variables) and body.
Header is used to authorize the request like
Authorization: FlespiToken XXXXXXXXX
According to the concepts of REST API, method is used for:
-
GET - receive information - list items, devices, messages, logs, etc. - this is always safe to call as it will not update anything
-
POST - create new item, register message, create a link and so on - any method that creates something
-
DELETE - delete item, delete telemetry, delete link, delete setting value and so on - the most dangerous method
-
PUT - modify existing item, update some fields and do on (PATCH - partly modify only specified fields, usually is used to update only part of configuration
For POST, PUT, PATCH and DELETE methods BODY is always in JSON format, exact structure and schema varies for each request and specified in the documentation. In GET methods body is empty and request parameters are passed as JSON object within data URL query variable.
URL - consists of:
-
path - hierarchical specification of the request that may include highly customizable REST selectors of the target items
-
fields list to limit the amount of the info of each item be returned in the response
-
pagination options to reduce the number of items
There is no possibility to sort or order by some field the output of REST API call. But you may use ApiBox table view of REST API response to sort the result by arbitrary column(field) directly in the UI.
Maximum allowed size of each URI component in the path is 64KB.
Complete OpenAPI specifications for each flespi module are available in JSON format: Gateway, Platform, Realm, MQTT, Storage, Auth, AI.
AI tools and MCP servers are also available for integrating flespi intelligence into external AI agentic development and support systems.
REST selectors
REST selectors are used to specify the items to apply REST API call to and located in the path part of URL.
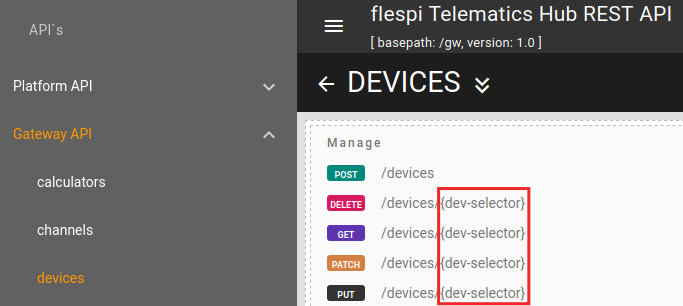
There are several ways to select items using REST selectors. Following examples are based on GET /gw/devices/{selectors} request to show the different options to filter devices list:
- “all” keyword to select all possible items - e.g. GET /gw/devices/all.
-
IDs list: each flespi item has an internal flespi ID that can be used in a comma-separated list in the selector - e.g. GET /gw/devices/1,2,3,4.
-
By field value using syntax field_name=value. For example GET /gw/devices/protocol_name=wialon-ips will return all devices that work over the wialon-ips protocol.
And PUT /gw/devices/configuration.ident="123456" will select for update operation device with IMEI 123456.
Or GET /gw/devices/connected=true will return to you all devices that are connected to flespi right now.
All available fields for each specific item type you can find in the interactive REST API documentation. - By assignment to a group, e.g. GET /gw/devices/groups.id=123.
- By {expression} which is a flespi-standard way to analyze messages, calculate counters or compile webhook payloads. The variables available for calculation are item fields. Expression must be enclosed in {curly brackets} - e.g. GET /gw/devices/{connected=true || configuration.ident="IMEI"}
-
For device selector also telemetry, plugin fields, metadata may be used - e.g. GET /gw/devices/telemetry.din>0.
To select entities by multiple selectors simultaneously specify them as a CSV list: selector1,selector2.
To select entities that satisfy any of selectors combine them inside expression: {selector1 || selector2}
| Use-case: select devices that | Selector value |
| belong to 2 different subaccounts | {cid=123 || cid=456} |
| have can.vehicle.mileage parameter in telemetry | {exists("telemetry.can.vehicle.mileage")} |
| have item-fields plugin field driver.name starts from "Andrew" substring | plugins.fields.driver.name="Andrew*" |
| has fleet_id with value 10 in its metadata property | metadata.fleet_id=10 |
| belong to a group with ID 1234 | either: groups.id=1234 or: {json_array_find(groups, "id=1234")} |
| device with specific IMEI | configuration.ident="123456789012345" |
| multiple devices by their IMEI | {configuration.ident in ("123456789012345", "111156789013333")} |
| all Teltonika devices | protocol_name="teltonika" |
| all devices of specified type Teltonika FMC640 | device_type_name="fmc640" |
| all Concox devices in group with ID 1234 | either: groups.id=1234,protocol_name="concox" or: {json_array_find(groups, "id=1234") && protocol_name=="concox"} |
| all Queclink GV500 devices with engine.ignition.status ON | device_type_name="gv500", telemetry.engine.ignition.status=true |
| not delivered any data to flespi for more than 24 hours | {last_active < (now() - 86400)} |
| located within 100 km from point with latitude 54.72 and longitude 25.26 | {distance(telemetry.position.latitude, telemetry.position.longitude, 54.72, 25.26) < 100} |
The best way to test your selectors is to use corresponding GET method for a call. When you execute API call using GET method you just listing items that available to you filtering them according to specified REST selectors.
For example call to GET /gw/devices/{last_active+86400<now()}?fields=id,name,last_active will return to you JSON array with all devices available to you that didn't connected to the platform more then 24 hours and each device represented as JSON object with parameters: id, name and last_active.
You can also use REST API selectors directly in flespi.io panel UI for quick items search. In flespi panel UI to use the result of REST API call to filter the list of visible items you put REST API selector inside exclamation signs - !selector!. For example to list only devices from specific group with ID 123 you write !groups.id=123! in the filter window at the bottom of devices list, to show only devices that have can.vehicle.mileage parameter in telemetry you write !{exists("telemetry.can.vehicle.mileage")}! and so on. Flespi panel will automatically copy what you typed inside !! and perform corresponding GET REST API call to filter the items it shows to you in the list. Thus utilizing REST API selectors you can quickly find and display only those devices, geofences, groups, subaccounts, tokens and so on as you need.
Please note that special assignment selectors such as groups.id, streams.id, calcs.id are not available inside expressions and you have to use different syntax there instead: {json_array_find(groups, "id=1234")}.
Fields and Pagination
Fields query variable is used to specify the exact number of fields of the items to be returned in response. If the item to be returned has non-plain structure, it is possible to specify comma separated path entries in the fields. E.g. to fetch devices list with ident and phone fields from configuration object and id field this request can be used.
Pagination query variables limit and offset can be used to fetch a limited number of items starting from a specific position. Offset is 0-based, so if you have 20 devices and you want to get them in 2 requests by chunks of 10 items then you should perform the request like
GET /gw/devices/all?limit=10&offset=0
GET /gw/devices/all?limit=10&offset=10
The response would be like:
{
"result": [{},{},...],
"pagination": {"limit": X, "offset": Y, "count": Z}
}
Where count is the total amount of items.
Note: Pagination and fields can not be used when requesting device messages and calculated intervals from flespi. For these methods you control number of returned items using call parameters inside data field (fields, max_count, etc).
Response format
REST API responses return a JSON object with the following structure:
- result - JSON array containing the selected items
- errors - JSON array with errors that occurred (optional)
- warnings - JSON array with warnings that occurred (optional)
Single item operations: When an error occurs, the appropriate HTTP status code is returned with error details in the response body:
{
  "result": [],
  "errors": [{"code": 3, "reason": "access denied or unable to process the item"}]
}
Multiple item operations: HTTP status code is always 200. Check the JSON response for individual item errors or warnings:
{
  "result": [
    {"id": 215},
    {"id": 217}
  ],
  "errors": [
    {
      "code": 3,
      "id": 222,
      "reason": "access denied or unable to process the item"
    },
    {
      "code": 3,
      "id": 445,
      "reason": "access denied or unable to process the item"
    }
  ]
}
The reason field in error objects contains human-readable description of the error and its details. The code field numerical value corresponds to standard HTTP status codes and suitable for automated processing of API call result:
| Code | HTTP Status | Description |
| 0 | 200 OK | Operation completed successfully |
| 1 | 500 Internal Server Error | Server error occurred, retry possible |
| 2 | 400 Bad Request | Invalid request format or parameters |
| 3 | 403 Forbidden | Access denied or authorization failed |
| 4 | 401 Unauthorized | Authentication required or failed |
| 5 | 429 Too Many Requests | Rate limit exceeded |
| 8 | 409 Conflict | Resolve the conflict and retry |
Always check both the HTTP status code and the errors array in the response body for complete error handling of API call.
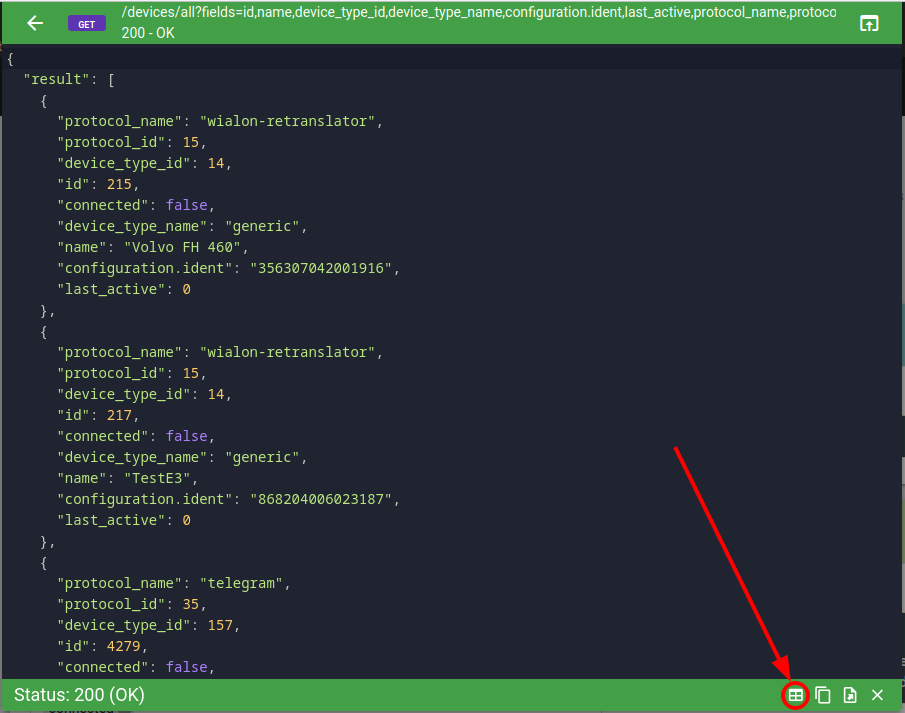
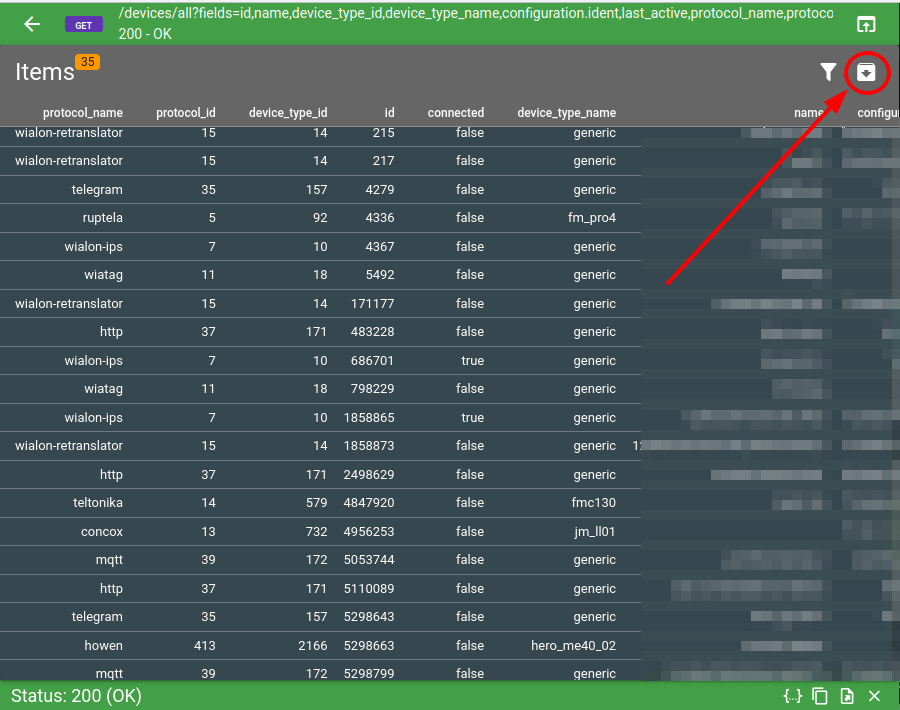
Export in CSV
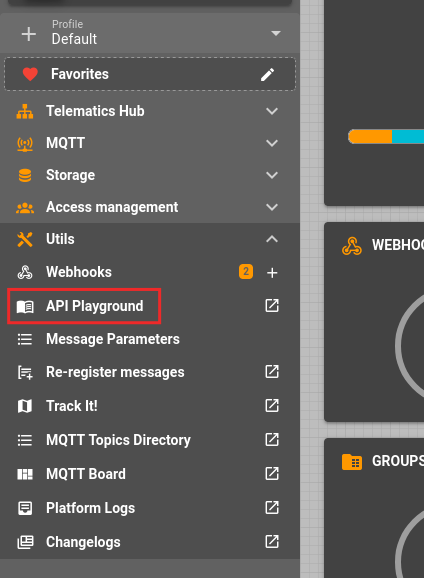
You can export any REST API call output in CSV using API Playground. After executing REST API call you switch to a table view by clicking on table icon in bottom-right corner. And after that you click on "Export in CSV" icon in top-right corner of table view:
 |
 |
Troubleshooting
In case of any issues with your REST API calls, flespi provides comprehensive logging and tracing capabilities to help you identify and resolve problems.
All REST API calls are logged and can be accessed via the "Platform Logs" button in the left-side menu of the flespi panel. These logs contain detailed information about each request, including token used, request parameters, source IP address and response information.
To improve traceability between your REST API requests and their corresponding actions, you can use the following custom headers:
- x-flespi-app: Can include the name of the application making the request, up to 63 bytes in length. It will be stored as the
appparameter in the related logs. - x-flespi-trace: Can contain a unique identifier for the request, up to 31 bytes in length. If omitted, flespi will generate one automatically. It will be stored as the
traceparameter in the related logs.
x-flespi-trace header is automatically returned to you in the REST API call response.
These headers allow you to track the entire chain of operations triggered by a specific API call. For example, when you update a device via REST API, you'll see in the Platform logs the API request log and in the device logs related device update event sharing the same trace identifier.
MQTT API
MQTT protocol is designed for secure and stable telemetry transport. In flespi it might be efficiently utilized to consume live events like device messages, calculated intervals or logs. Code snippets on different programming languages can be found on flespi Github page.
MQTT broker specification
| Connection configuration |
|
| Host | mqtt.flespi.io |
| Port | MQTT over TCP: 8883 (SSL) or 1883 (non-SSL)
MQTT over WebSockets: 443 (SSL) or 80 (non-SSL) |
| MQTT version | 3.1, 3.1.1, 5.0 |
| QoS supported | QoS 0, QoS 1 |
| Authorization | flespi token as username or password
or username=token ID, password=at least 16 first bytes of the token key |
MQTT concepts:
- client id should be unique within your account space
- subscription topics may have wildcard masks: + for one level, # for rest till the end
- non-clean sessions store undelivered messages and deliver it upon session reconnect
- you can't publish to topic that starts from flespi/ - it is reserved for MQTT API
- message published with retained flag is stored in broker and delivered upon subscription
Standard flespi topics
All the events published via flespi MQTT API are covered by MQTT Topics Directory tool and listed here.
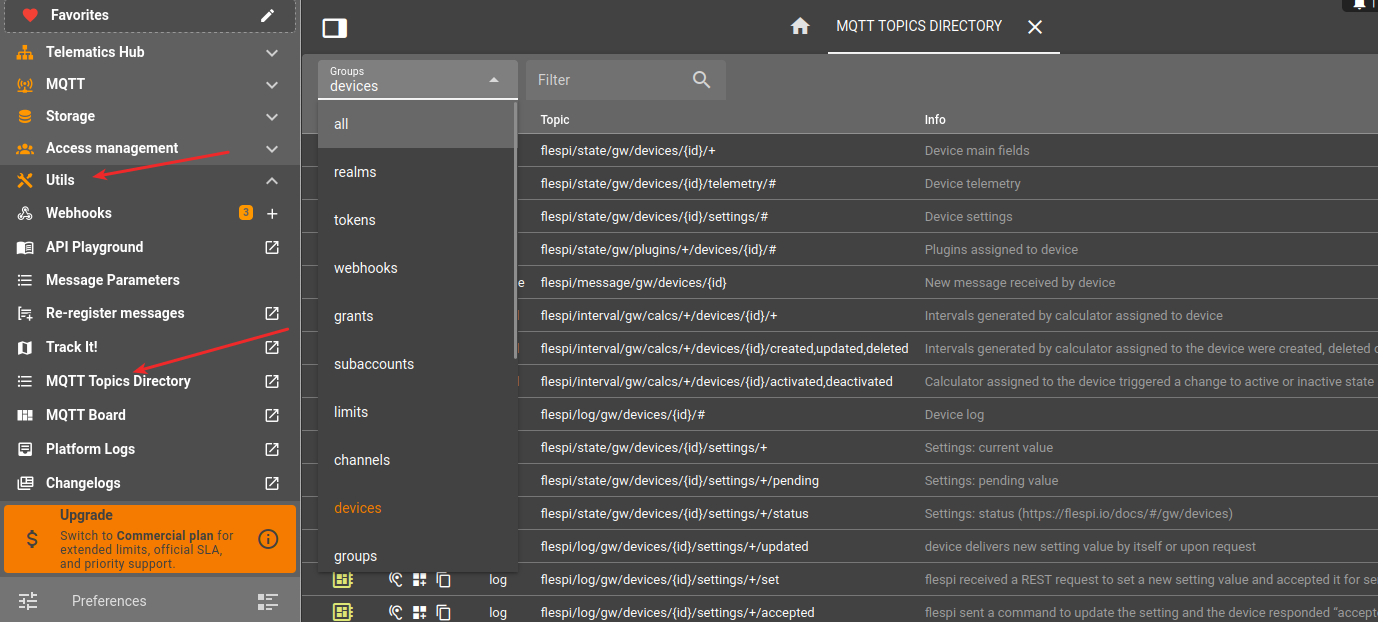
Full flespi MQTT topics listing is also available via topics directory UI or as a standalone JSON file.
Topic filtering
Subscription topic may contain special prefix that enables server side message filtering. It allows to reduce the number of messages received by the MQTT client. The common format of the topic is:
$filter/<filter-specification>/original-topic
Messages can be filtered by:
- subaccount ID. E.g. to get messages published by devices that belong to subaccount with ID=123 the subscription topic is: $filter/cid=123/flespi/message/gw/devices/+
- publication time. E.g. to receive only messages published after 11/14/2023 22:13:20 GMT subscription topic is $filter/modified_since=1700000000/flespi/message/gw/devices/+
- payload. When you filter by payload, the filter is executed as expression and must be url-encoded.
- E.g. if you subscribe for battery.voltage telemetry and want to receive only messages when voltage is higher than 14 volts, then subscription topic is $filter/payload=tonumber%28payload%29%3E14/flespi/state/gw/devices/+/telemetry/battery.voltage. Here the payload is number, filter value is tonumber(payload)>14.
- If the payload is device message and you want to receive messages only when position.speed is higher then 10, then subscription topic is $filter/payload=position.speed%3E10/flespi/message/gw/devices/+. Here the payload is message JSON and filter value is position.speed>10. Keep in mind that in the filtering expression you may only reference parameters that present in actual message payload. When filtering device messages you may specifically use plugins to enrich device message with extra parameters that you may need for filtering.
- complex message object expression. Message filter can be filtered by expression that may refer to:
- topic - a topic string
- topics - an array with topic words splited by '/'
- cid - publisher id
- timestamp - message timestamp
- user_properties - an object with list of user properties
- payload - a string with message payload
e.g. we have following topics: temperature/kitchen, temperature/bedroom, temperature/hall. Message payload is a temperature. So we want to receive temperature from kitchen and hall if it is below 20 degrees.
Message filter is: topics[1] in ("kitchen","hall")&&tonumber(payload)<20
Subscription with encoded filter is: $filter/message=topics%5B1%5D%20in%20(%22kitchen%22%2C%22hall%22)%26%26tonumber(payload)%3C20/temperature/+
To combine multiple filter specifications in a single subscription join them using `&` - e.g.: $filter/cid=123&modified_since=1700000000&payload=tonumber%28payload%29%3E14/flespi/message/gw/devices/+
MQTT over REST
Publish to topic flespi/rest/{method}/{api-uri} to perform REST API call to the flespi platform. {method} should be lowercase and valid for the specified {api-uri}. Optional data parameter may be passed as MQTT message payload. MQTT v5.0 accepts "response topic" parameter with the indication of the topic to which to publish a response to API call. Otherwise, the response is published to the same topic.
Additional user property "response_cid" allows redirecting the response to another subaccount. This is a special feature helpful when you want to perform an API call on the top-level (from the master account) and redirect its result from the flespi broker directly to one of the subaccounts.
One more feature is the "response_chunked" user property. If it's "true", the response will be chunked in multiple MQTT messages. A message with the specified "http_code" user property is the indication of the last chunk (message).
Learn more in the corresponding blog article.
Other options
-
Consume messages in various cloud IoT and telematics platforms in PUSH mode using Streams
-
Set up automation based on events that adopt some conditions using Webhooks
-
Export any REST API call result (all or specific devices, streams, channels, etc) into CSV using API Playground
Code examples
Our team created few open source scripts and integrations you may review and clone for your needs. Most of them are located in our repository on GitHub:
-
TrackIt - A GPS tracking application based on flespi.io and built with Quasar and Leaflet.js. Shows devices on the map and their telemetry messages. Includes a track player.
-
flespi-io-js - an isomorphic open-source library based on Axios and MQTT.js for easier access and communication with the flespi.io resource.
-
mqtt-telemetry-dashboard - example of using mqtt to receive and display telemetry data from devices with mapview and flespi login widgets.
-
http-stream-receiver - scripts in different programming languages (PHP, PHP+MySQL, Python, Node.js) to deploy on your server to receive the telemetry data from the flespi HTTP stream.
-
flespi_pipeline - Python solution for GDPR compliance that gets messages from a flespi channel via MQTT, applies Private Data Switch algorithm, and publishes to a topic.
-
flespi_receiver - Python module that consumes and custom processes messages from a flespi channel and sends them over MQTT to AWS and HTTP POST handlers.
-
mqtt-message-handler - Python script to aggregate messages coming from the flespi channel into a MySQL database using the gmqtt library.
-
devices-creation-tool - the wizard-like tool to create multiple devices of the same device type in your flespi.io account. Also generates a cURL to paste into the command line.
-
message-converter - node.js and python script to convert device messages to JSON, KML, GPX, GEOJSON, CSV formats.
-
mqtt-client - generic MQTT client usage samples in python, node.js, lua, javascript.
-
ESP32/ESP8266 channel sender - simple example of how to send data from ESP32/ESP8266 boards to the flespi channel via http/https (with root CA/fingerprint).
-
msg-webhook-plugin-listener - PHP and Node.js webhook plugin listeners that can enhance device message with extra information from your data.
What's next?
The best way to explore all flespi capabilities is to watch detailed videos from our conference. Invest your time into watching them to save much more time and money later, when you will implement your project: